
FIGURE 1.
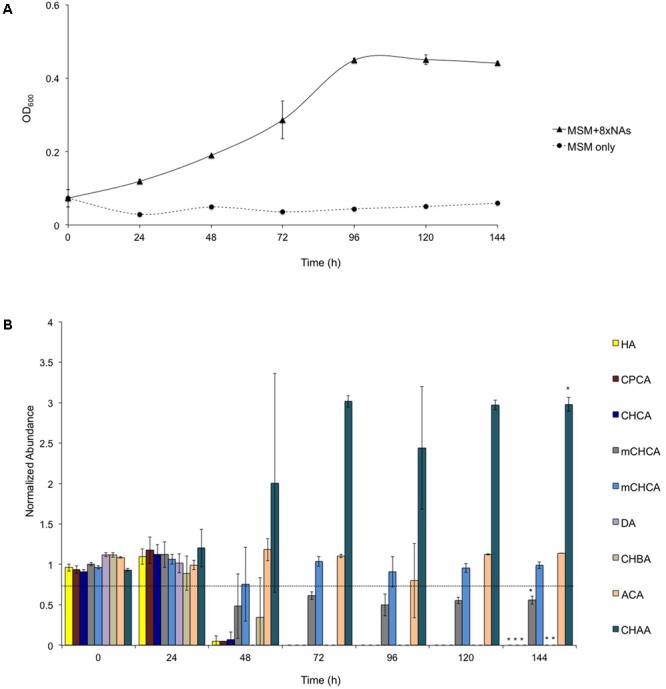
Growth of Rhodococcus aetherivorans BCP1 during the utilization of the 8XNA mixture (A) and residual concentration of individual components of the 8XNA mixture over time (B). GC-FID was used to determine normalized abundance values relative to an internal standard (n = 3). Error bars represent standard error of the mean. A normalized abundance value of ‘1.0’ represents starting NA levels. The final OD600 value reached with 8XNAs is significantly different from the final value reached by the control culture, i.e., the BCP1 culture w/o the addition of 8XNAs upon two-factor ANOVA with replication test (P < 0.01). Asterisks above the 144 h data denote that the concentration of each NA detected at 144 h is significantly different from that revealed at the beginning of the experiment (0 h) based upon two-factor ANOVA with replication test (P < 0.01).