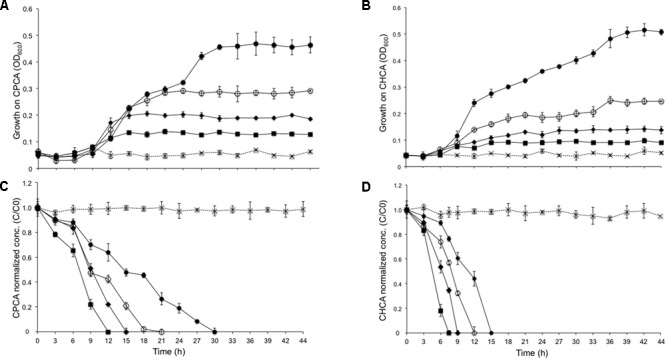
FIGURE 2.

Growth of R. aetherivorans BCP1 during the utilization of CPCA (A) or CHCA (B) at different concentrations (filled squares for 50 mg L-1, filled diamonds for 100 mg L-1, empty round circles for 200 mg L-1, filled round dots for 500 mg L-1) and corresponding degradation of the two NAs over time (C for CPCA and D for CHCA). In the degradation graphs, a normalized abundance value of ‘1.0’ represents starting NA levels. Error bars represent standard error of the mean (n = 3). The growth and degradation curves for the sterilized controls are shown as cross marks. The final OD600 values (44 h) reached with all the NA concentrations tested (except for CHCA 50 mg L-1) are significantly different from the final OD600 value reached by the control culture, i.e., the BCP1 culture w/o the addition of any NA based upon two-factor ANOVA with replication test (P < 0.01).
