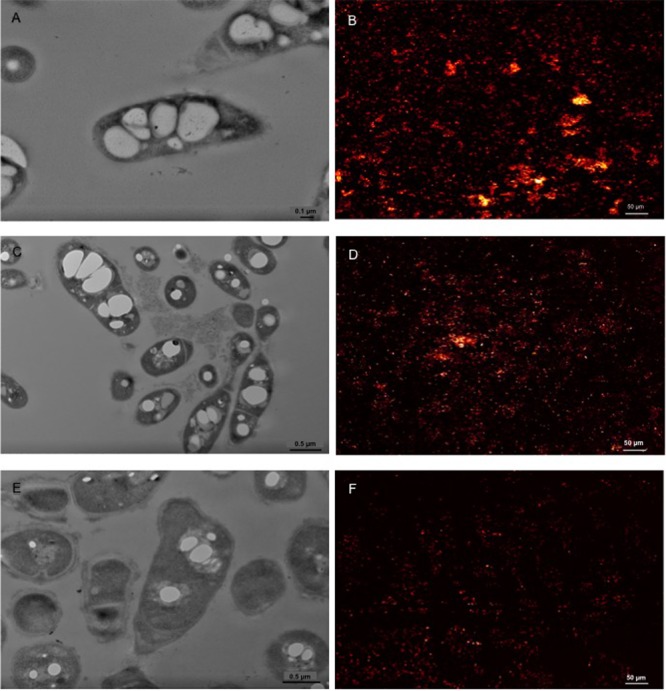
FIGURE 4.

Representative TEM pictures of BCP1 cells grown on glucose (1% w/v; A), CHCA (500 mg L-1; C) or CPCA (500 mg L-1; E) under nitrogen depletion conditions and the corresponding CLSM images displaying cells treated with the lipophilic dye Nile Blue A (glucose, B; CHCA, D; CPCA, F). The picture of BCP1 cells grown on LB is shown in Supplementary Figure S3.
