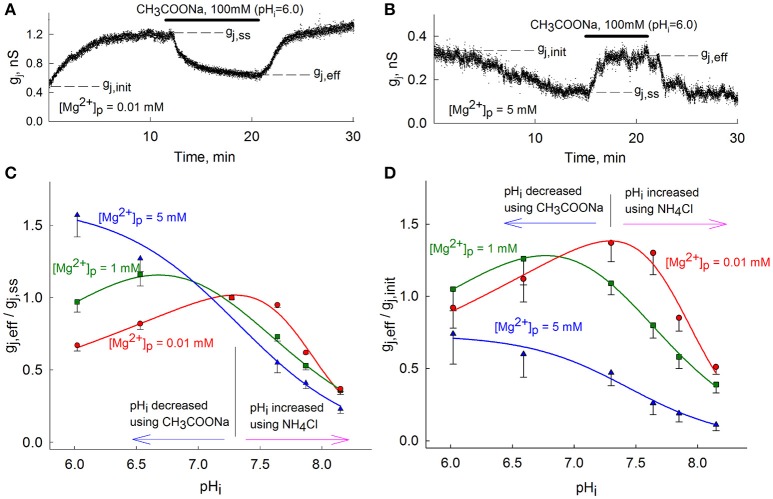
Figure 1.
Modulation of gj-pHi by [Mg2+]p. (A,B) gj measurements over time using low (A) or high (B) [Mg2+]p followed by CH3COONa-induced acidification to pHi = 6.0; (C) The (gj, eff/gj, ss)-pHi dependence of Cx36-EGFP GJs at different [Mg2+]p. Data are normalized to gj, ss at each different [Mg2+]p before changes in pHi. (D) The same as in (C), but normalized to gj, init. To avoid overlap, only lower ranges of standard error are presented in (C,D). Vertical black lines in (C,D) are located at pHi = 7.3.

