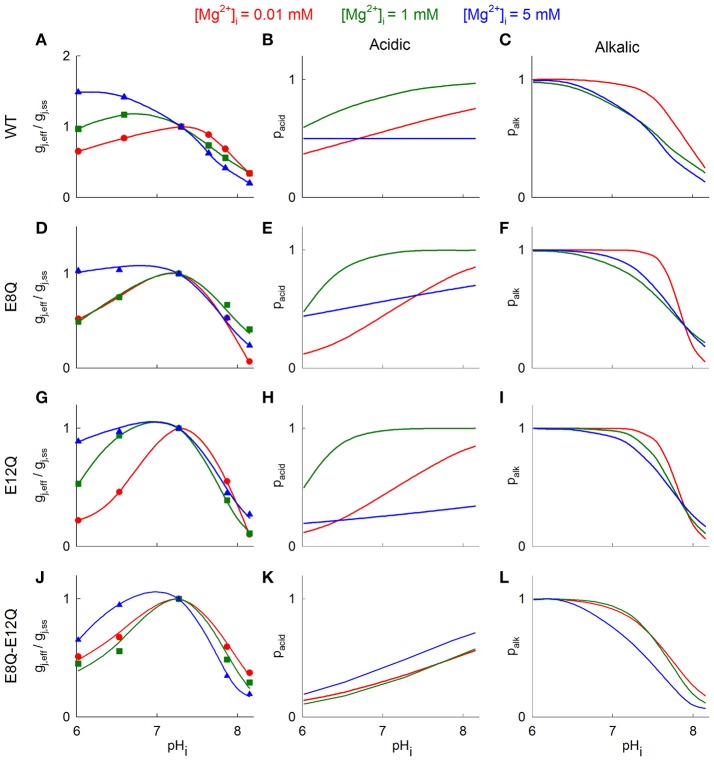
Figure 4.
Mathematical model of gj changes in response to pHi under different [Mg2+]i. (A) Hypothetical gj-pHi curves fitted to experimental data. Blue triangles denote gj values at [Mg2+]p = 5 mM, green squares—at [Mg2+]p = 1 mM, and red circles - at [Mg2+]p = 0.01 mM. The theoretical gj-pHi plots were obtained from the Equation (2). (B,C) shows theoretical open channel probabilities in response to acidic gating (B) and alkalic gating (C), which were estimated from (1). Red, green and blue lines denote gj-pHi dependence at [Mg2+]i = 0.01, 1, and 5 mM, respectively. (D–L) show the same results as (A–C) with Cx36 mutants.

