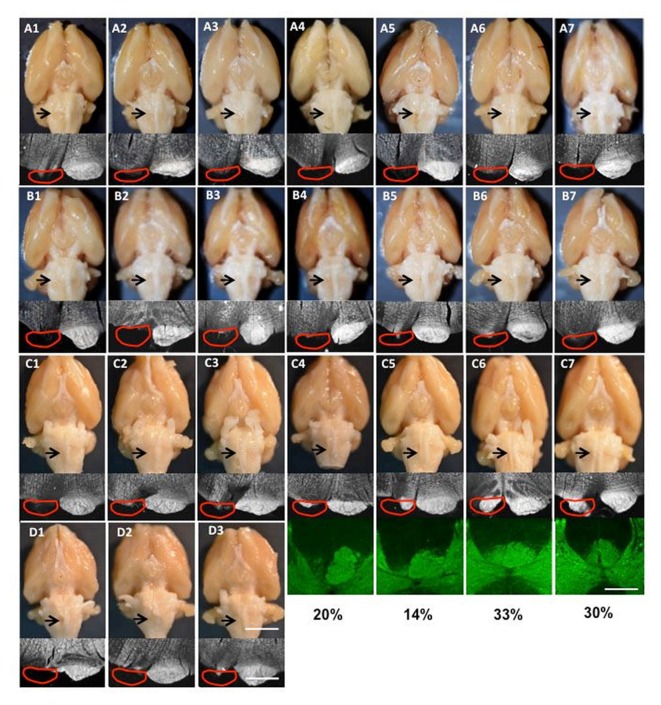
Figure 2.
Images of lesions of all rats used in the study. (A1–7) Group I for tracing and intracortical microstimulation (ICMS); (B1–7) Group II only for tracing; (C1–7) supination task and motor cortex inactivation; (D1–3) pasta manipulation and ladder walking. The top row is the ventral view of the whole brain; the arrow shows the cut lesion. The second row shows dark-field images of coronal section through the cut level. The red line shows the approximate position of the pyramid that was the cut. The bottom rows in (C4–7) show protein kinase C-γ (PKC-γ) staining in the dorsal column with the percentage of CST spared after neonatal pyramidotomy. Bar = 4 mm (top row in D3), 12.5 mm (bottom row in D3), 5 mm (the third row in C7).

