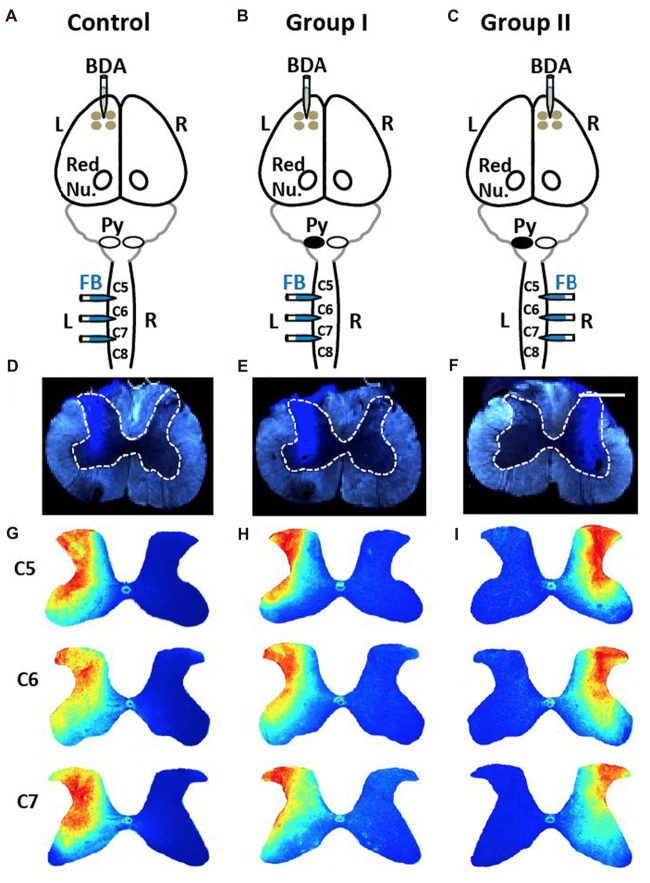
Figure 5.
No differences in injections of Fast Blue (FB) into spinal cord among three groups. (A) Control rats received four injections of the anterograde tracer biotin-dextran (BDA) into the left (L) primary cortex and three injections of the retrograde tracer FB into the left side of the spinal cord. Red Nu., red nucleus. (B) Group I rats with neonatal pyramidotomy (indicated by the black oval next to pyramid, Py) received BDA injections into the left primary cortex and the FB injections into the left side of the spinal cord. (C) Group II rats with neonatal pyramidotomy received BDA injections into the right (R) primary cortex and the FB injections into the right side of the spinal cord. (D–F) Representative images of FB injections in the control rats and the rats with pyramidotomy. The dotted lines show the gray matter in the spinal cord. Bar = 0.5 mm. (G–I) Heat maps of distribution of FB in the spinal cord of C5, C6 and C7 of the control rats and the rats with neonatal pyramidotomy. Note the similar distribution among three groups.

