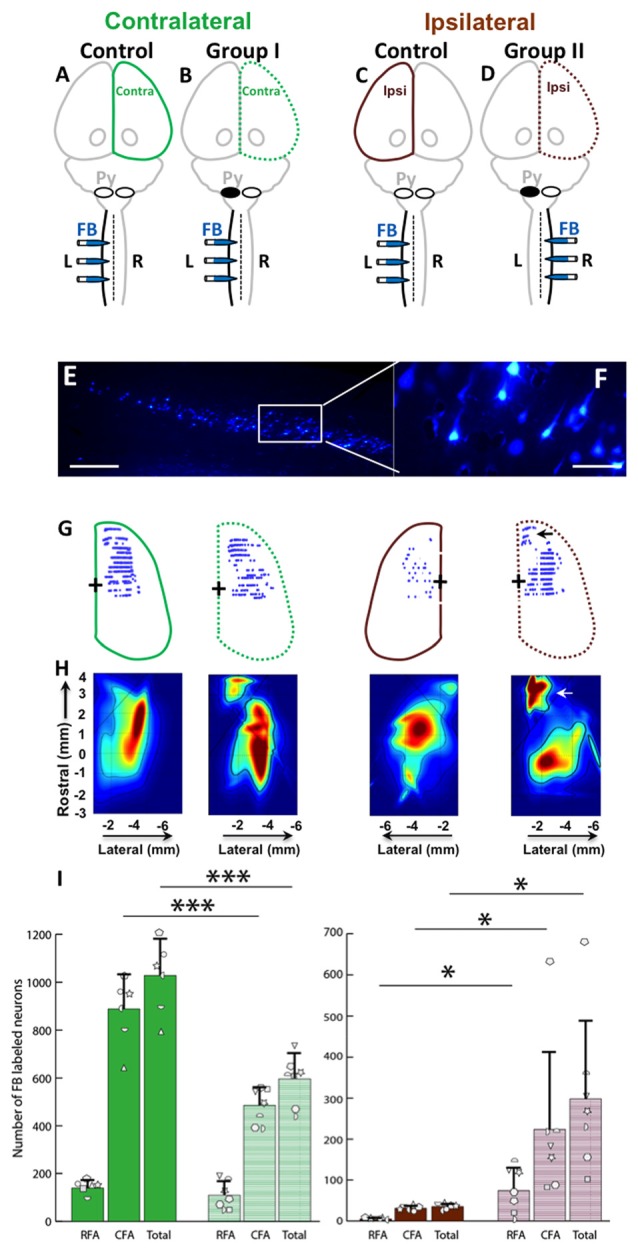
Figure 6.

Cortical maps showed large increase in ipsilateral representation, especially in the rostral forelimb area (RFA), and loss of contralateral representation. (A–D) Experimental schema of injections of FB, pyramid (Py) cut, and shading of the cortex that was analyzed. (A,C) Control rat with FB injection into the left (L) side of the spinal cord; this was one group of rats, but each hemisphere was compared against a different group (Group I and Group II) of the rats with neonatal pyramitomy. The contralateral (Contra) hemisphere was compared against Group I, and the ipsilateral (Ipsi) hemisphere was compared against Group II. (B) Group I rats with FB injection into the left (unimpaired) side of the spinal cord. (D) Group II rats with FB injection into the right (impaired) side of the spinal cord. (E,F) FB-labeled neurons in the motor cortex (1.5 mm rostral to bregma) of a representative rat from Group II. Bar = 250 μm (E) or 50 μm (F). (G) Maps of distribution of the FB-labeled neurons in the cortex of the control rats and the rats with neonatal pyramidotomy. The + symbol indicates bregma. (H) Heat maps of probability density distribution of the FB-labeled neurons in the cortex of the control rats and the rats with neonatal pyramidotomy. Dark red indicates high probability (approach 1) and dark blue indicates low probability (approaching 0) There were two distinct representations in the rats with neonatal pyramidotomy, the (RFA, indicated by the arrows) and the caudal forelimb area (CFA) in the ipsilateral cortex. (I) The number of the FB-labeled neurons in the cortex. Note that the FB-labeled neurons in the ipsilateral cortex were significantly increased in the rats with neonatal pyramidotomy in comparison to the control rats; however, the numbers in the contralateral cortex were significantly reduced. Plotted white shapes represent the number for each rat in each group. Each rat’s data corresponds to a type and orientation of shape. Data = mean ± SD. *p < 0.05, ***p < 0.005, significant compared to the corresponding values in the control rats.
