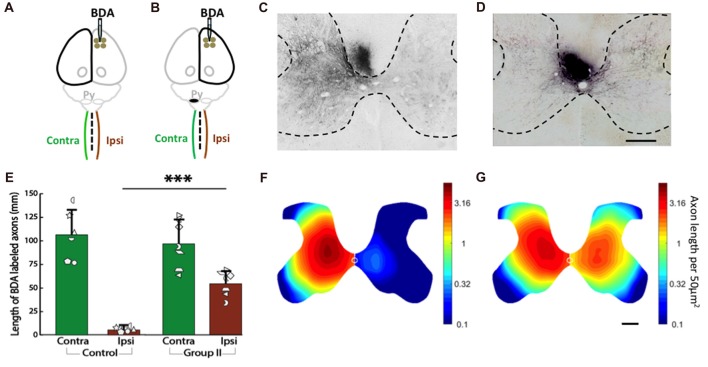
Figure 7.
Strong bilateral connections from the motor cortex of the uninjured hemisphere after neonatal pyramidotomy. (A,B) Experimental schema of injections of BDA, pyramid (Py) cut, and the analysis of the spinal cords in the Control (A) and Group II (B). (C,D) BDA-labeled axons in the spinal cords of the Control (C) and Group II (D). Bar = 250 μm. (E) Average BDA-labeled axon length in the spinal cords of the Control and the Group II. Note that there were significant differences in the distribution and the length of the BDA-labeled axons in the ipsilateral side, but not in the contralateral side of the spinal cord between the Control and the Group II. Plotted white shapes represent each rat’s data points. Each rat’s data corresponds to a type and orientation of shape. (F,G) Heat maps of probability density distribution of the BDA-labeled axons in the spinal cords of the Control (F) and the Group II (G). Note that the scale is logarithmic. In Group I, the pyramidotomy removed all of the CST axons from the injured hemisphere; therefore, Group I was not shown here. ***p < 0.005, significant compared to the same side of the Control.

