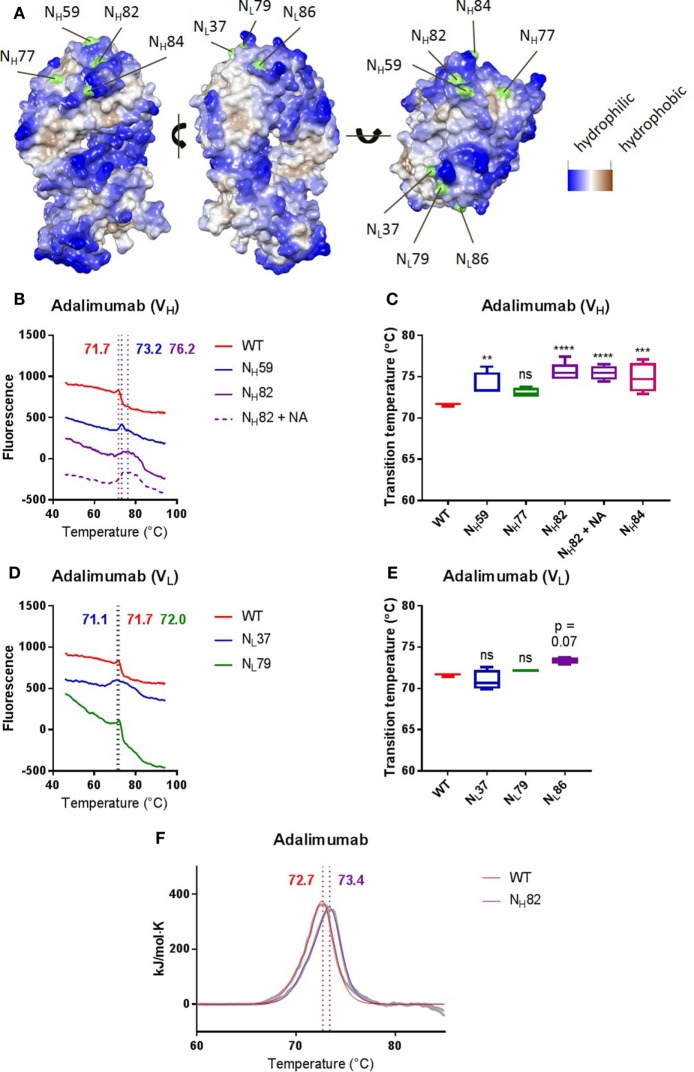
Figure 3.
Introducing Fab glycans can improve adalimumab stability. (A) The Fab arm of adalimumab with introduced glycosylation sites indicated in green. Sites were introduced in the heavy (left) or light (middle) chain. The more blue, the more hydrophilic, and the more brown, the more hydrophobic. (B) Thermal unfolding profiles of adalimumab wild-type (WT, red), VH mutants (NH59, blue; NH82, purple), and NH82 treated with neuraminidase (NH82 + NA, dotted purple) were determined as described in Figure S3 in Supplementary Material. Thermal unfolding profiles were shifted up or down for clarity. Values in graphs represent obtained Tm (local maxima). Shown are representative data of at least four replicates. (C) Tm of adalimumab VH variants, determined as described in Figure S3 in Supplementary Material. Shown are medians of at least four replicates with IQR. One-way ANOVA compared with WT, **P < 0.01, ***P < 0.001, and ****P < 0.0001. (D) Thermal unfolding profiles of adalimumab WT (red) and VL mutants (NL37, blue; NL79, green) were determined as described in Figure S3 in Supplementary Material. Thermal unfolding profiles were shifted up or down for clarity. Values in graphs represent obtained Tm (local maxima). Shown are representative data of at least four replicates. (E) Tm of adalimumab VL variants, determined as described in Figure S3 in Supplementary Material. Shown are medians of at least four replicates with IQR. One-way ANOVA compared with WT. (F) Thermal unfolding profiles of adalimumab WT (red) and NH82 (purple) were determined using differential scanning calorimetry. The data are shown in gray and the fits in red and purple. The data were fitted using a non-two-state model with two peaks, and values in graphs represent obtained Tm (maxima) of the main peak. Shown are representative data of two replicates.

