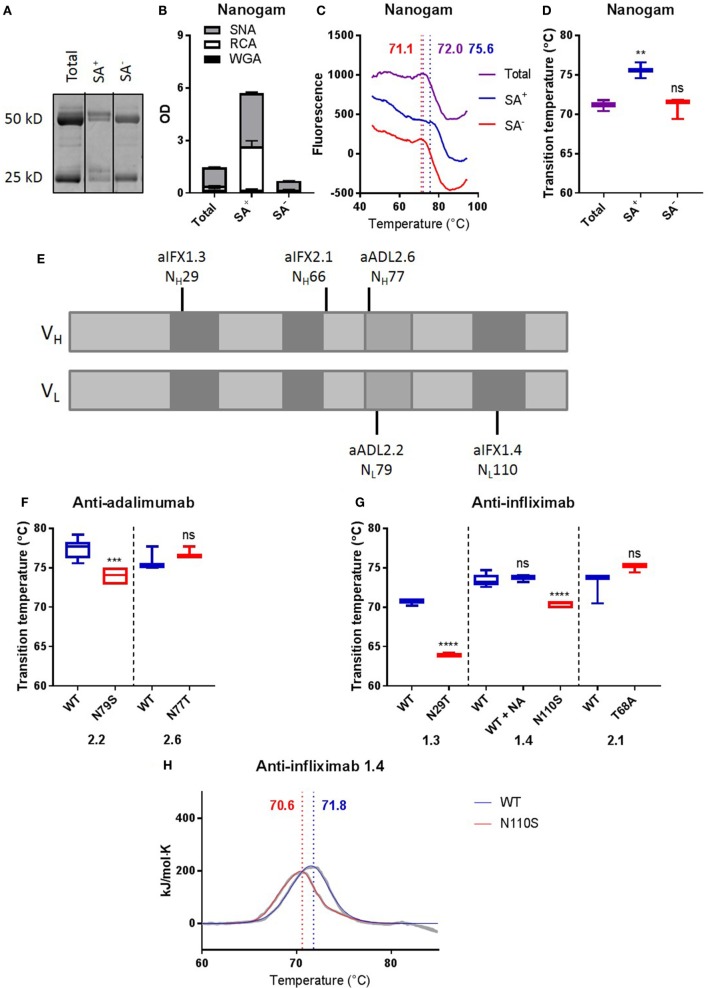
Figure 4.
Removing Fab glycans can deteriorate antibody stability. (A) Gel electrophoresis of nanogam total, sialic acid enriched (SA+), and sialic acid depleted (SA−). (B) Lectin ELISA data for Nanogam total, SA+, and SA−. WGA recognizes N-acetylglucosamine, RCA recognizes galactose, and SNA recognizes sialic acid. (C) Thermal unfolding profiles of Nanogam total (purple), SA+ (blue), and SA− (red) were determined as described in Figure S3 in Supplementary Material. Thermal unfolding profiles were shifted up or down for clarity. Values in graphs represent obtained Tm (local maxima). Shown are representative data of 10 replicates. (D) Tm of Nanogam, determined as described in Figure S3 in Supplementary Material. Shown are medians of three batches with three to four replicates for each batch with IQR. One-way ANOVA compared with total, ****P < 0.0001. (E) Positions of glycosylation sites in sequences of two anti-adalimumab and three anti-infliximab clones. Light gray represents framework regions, dark gray represents complementarity determining regions, and middle gray represents DE loop. (F) Tm of anti-adalimumab variants, determined as described in Figure S3 in Supplementary Material. Shown are medians of at least three replicates with IQR. Unpaired t-test compared with wild-type (WT), ***P < 0.001. (G) Tms of anti-infliximab variants were determined as described in Figure S3 in Supplementary Material. Shown are medians of at least three replicates with IQR. One-way ANOVA or unpaired t-test compared with WT, ****P < 0.0001. (H) Thermal unfolding profiles of anti-infliximab 1.4 WT (blue) and mutant (N110S, red) were determined using differential scanning calorimetry. The data are shown in gray and the fits in blue and red. The data were fitted using a non-two-state model with two (WT) or three (N110S) peaks, and values in graphs represent obtained Tm (maxima) of the main peak. Shown are representative data of two replicates.

