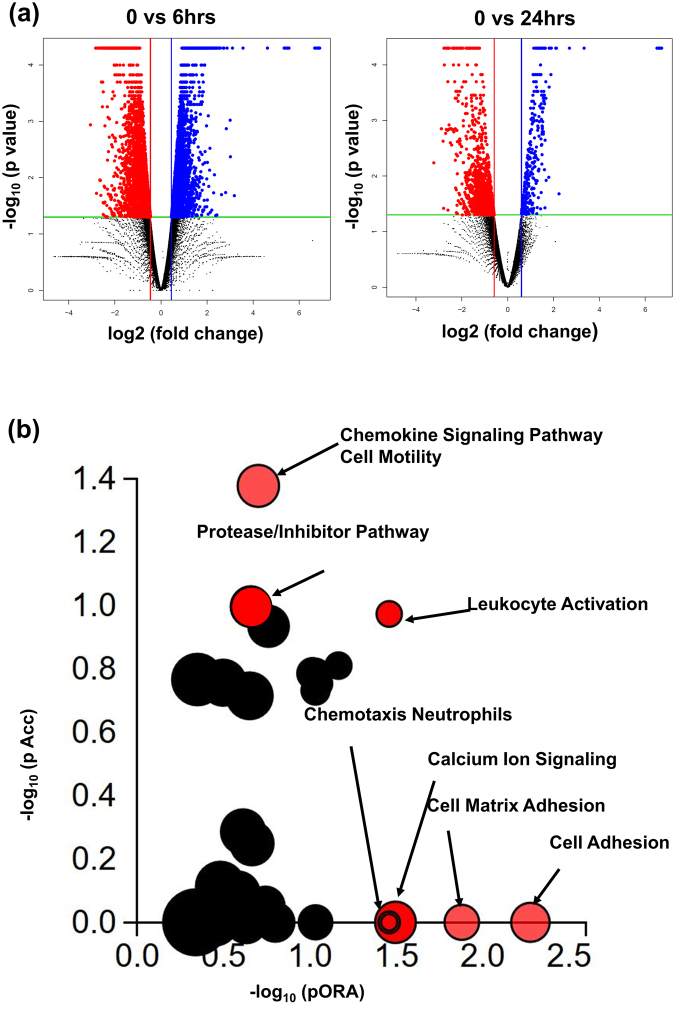
Figure 2.
MSCs pretreated with S100A8/A9 reveal a distinct transcriptome signature with impact on enhanced tissue repair. (a) Volcano plot representative of the entire gene expression data (untreated MSCs versus MSCs treated with S100A8/A9 for 6 h (left) and 24 h (right) were studied by DEseq. 2 analysis tool, where the log10 P-value (FDR <0.5) of each gene is plotted against log 2 fold for that gene. Differentially expressed (DE) genes (FDR <5%) and fold change (mean >1.5) are highlighted either in blue as upregulated or highlighted in red as downregulated. The non-significant genes which (FDR >5%) are highlighted in black. (b) Pathway analysis was done on the DE genes (log2-fold change >0.6 and FDR <5%) employing iPathwayGuide analysis tool that uses two types of evidence: the over-representation on the horizontal axis (pORA) and the perturbation on the vertical axis (pAcc). Significant pathways with (FDR <5%) are shown in red, whereas non-significant are in black. The size of the circle is proportional to the number of genes in that pathway.

