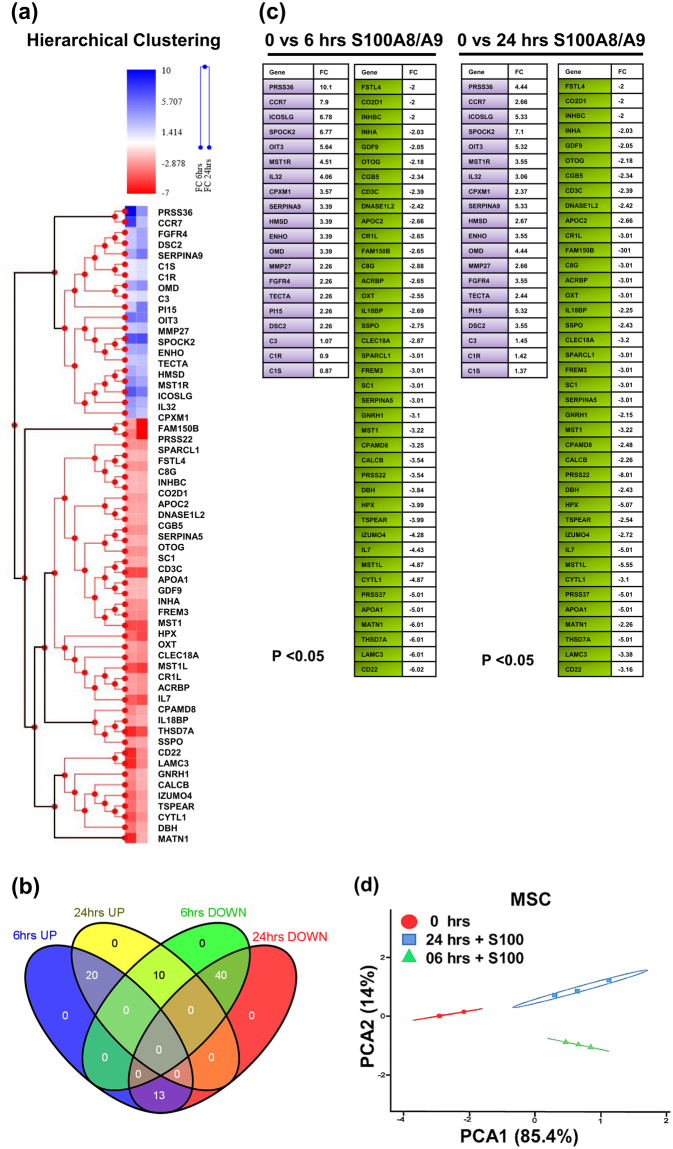
Figure 3.
RNAseq expression profile of MSCs exposed to S100A8/A9. (a) Shows the hierarchical clustering of pre-ranked secretory genes using Pearson’s correlation for the RNAseq expression profile of human MSCs stimulated with S100A8/A9 for 6 and 24 h as compared to PBS treated control MSCs. The upper left panel shows the fold changes (FC) of gene expression after 6 and after 24 h of MSC treatment with S100A8/A9 compared to PBS treated MSCs. Blue shades show an increase in gene expression, red shades show a decrease in gene expression as compared to PBS treated control MSCs. The sub clusters below depict genes which are either persistently up-regulated or downregulated at 6 and at 24 h following S100A8/A9 exposure. (b) The Venn diagram highlight the overlap of genes which are up-regulated or down regulated at 6 and 24 h. We specifically concentrated on the expression profile of genes which are persistently up-regulated at 6 and 24 h (20 genes in light purple color) or persistently down-regulated at 6 and 24 h after S100A8/A9 exposure (40 genes in shaded green). (c) Depicts the expression levels (as fold change) and the annotation of the corresponding genes. (d) The first principal component accounted for 85.4% of the total variability, which in this case corresponds to the unstimulated MSC variance (highlighted in red), and the subsequent principal components accounted for 14% of overall variance (highlighted in green & blue), highlighting the difference between the unstimulated MSC and S100A8/A9 stimulated MSC (6 h and 24 h), respectively. Principal component analysis (PCA) of the sample correlation matrix calculated from log2 transformed FPKM values. Differences in gene expression of at least 2-fold and a P-value < 0.05 (Student´s T-Test) were selected.

