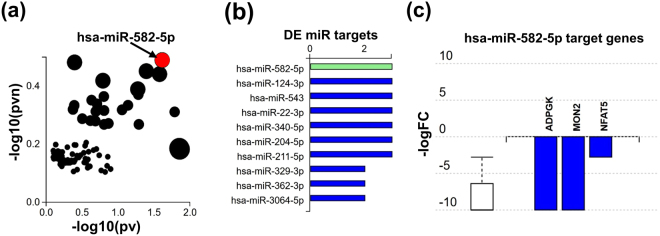
Figure 4.
Differential miR expression and target genes between S100A8/A9 treated MSCs and control MSCs. (a) Significant differences in specific miR expression. Analysis is based on the differentially expressed (DE) miR (log2-fold change >0.6 and FDR <5%) using iPathwayGuide analysis tool that uses two types of evidence to represent the X-Y plot: the horizontal axis (−log10(pv)) representing the p-value based on the total number of DE target genes versus the total number of target genes and the vertical axis the (−log10(pvn)) is the p-value based on the number of downwardly expressed DE targets versus the total number of DE miR targets. The size of each dot is directly proportional to number of target genes for that miRNA relative to other ones. Significant miR’s with (FDR <5%) such as has-miR 582-5p are shown in red, whereas non-significant are in black. (b) Represents the miR expression profile of non-stimulated versus stimulated MSCs with S100A8/A9 depicting the relative counts for each miRNA. (c) Shows selected miRNA hsa-miR-582-5p target genes which are significantly suppressed following S100A8/A9 treatment of MSCs. The suppression is represented by log fold change in stimulated MSCs versus non-stimulated MSCs.

