Figure 3.
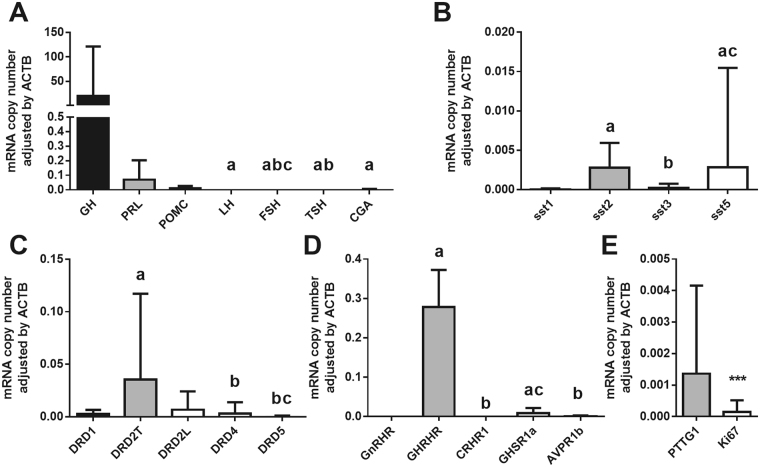
Molecular characterisation of the somatotropinomas. Seventeen somatotropinomas were available to determine by quantitave real-time PCR (qPCR) the expression profile of: (A) pituitary hormones [growth hormone (GH), prolactin (PRL), proopiomelanocortin (POMC), luteinizing hormone (LH), follicle stimulating hormone (FSH), thyroid-stimulating hormone (TSH) and the alpha subunit of the glycoproteins (CGA)]; (B) the five somatostatin receptors subtypes (sst1-5); (C) the five dopamine receptors subtypes (DRD1-5), including the total and large isoform of DRD2 (DRD2T and DRD2L, respectively); (D) other receptors [gonadotropin releasing hormone receptor (GnRHR), growth hormone releasing hormone receptor (GHRHR), corticotropin releasing hormone receptor (CRHR1), ghrelin receptor (GHSR1a), arginine-vasopressin receptor 1b (AVPR1b); and (E) and two proliferation markers [securin (PTTG1) and Ki67]. Data represent median ± interquartile range of absolute expression levels (copy number) of each transcript adjusted by the expression levels of a control gene (ACTB). Values in A-D that do not share a common letter are statistically different (P < 0.05) using a Kruskal-Wallis test followed by a Dunn’s multiple comparisons test. Mann-Whitney test was used for E (*** indicates P < 0.001).

