Fig. 1.
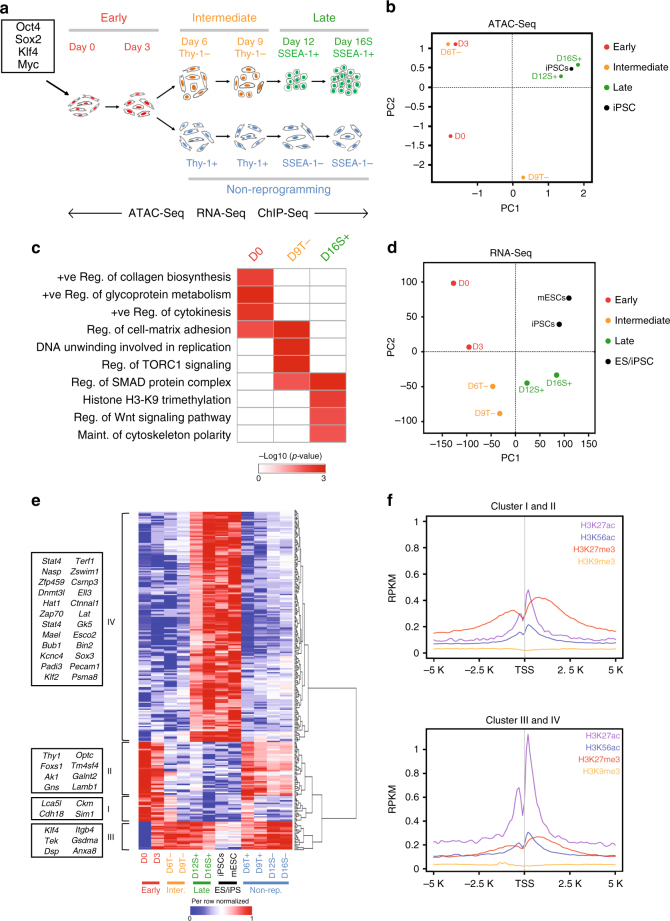
Reprogramming induces transcriptomic and chromatin rewiring. a Schematics of the cellular reprogramming indicating the time-points at which chromatin and RNA were collected for libraries preparation. b PCA of ATAC-Seq libraries. c Differential GO analysis revealing enriched biological processes in D0, D9T− and D16S+-accessible genes. The colour ranges from white (no enrichment) to dark red (high enrichment). d PCA of RNA-Seq libraries. e Heatmap demonstrating the dynamic expression of differentially expressed genes between D0 and iPSCs. The boxes to the left indicate genes belonging to each cluster. The values are per-row normalized FPKM and colour ranges from dark blue (low expression) to dark red (high expression). f Average enrichment profile of mESC H3K27ac, H3K56ac, H3K27me3 and H3K9me3 around the TSS of genes belonging to Cluster I and II (top) and Cluster III and IV (bottom). The y-axis represents average normalized number of fragments at the corresponding genomic regions indicated in the x-axis

