Fig. 2.
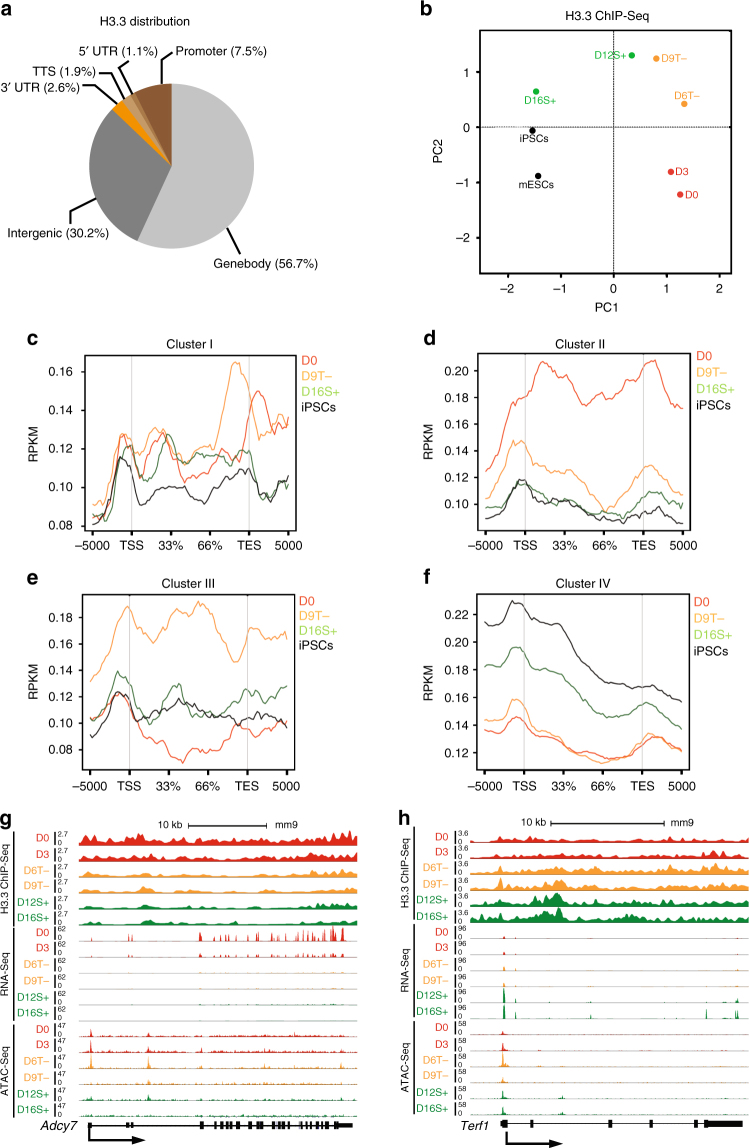
Dynamic deposition of H3.3 during cellular reprogramming. a Average distribution of H3.3 peaks on the indicated genomic regions during cellular reprogramming. b PCA of H3.3 ChIP-Seq libraries at the indicated time-points. c–f Average enrichment profile of H3.3 reads, belonging to the libraries at the indicated time-points, around the genebodies of Cluster I (c), II (d), III (e) and IV genes (f). The y-axis represents average normalized number of fragments mapping to the corresponding regions indicated in the x-axis. g UCSC screenshot of the dynamic chromatin accessibility, gene expression and enrichment of H3.3 on Adcy7 (Cluster I gene) during reprogramming. h UCSC screenshot demonstrating the dynamic chromatin accessibility, gene expression and enrichment of H3.3 on Terf2 (Cluster III gene) during reprogramming

