Fig. 5.
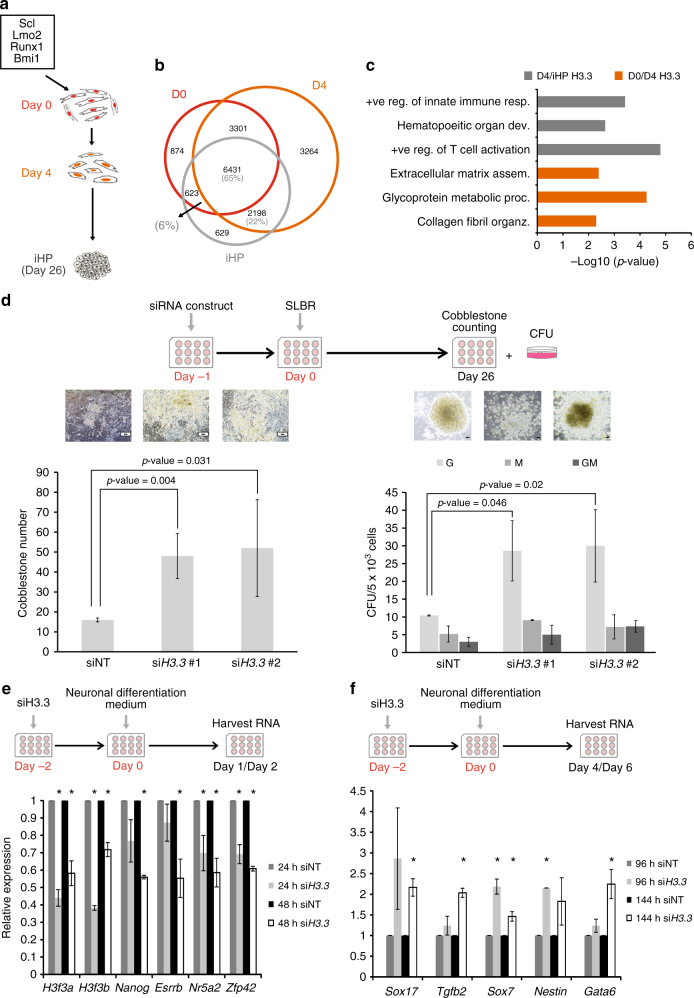
Role of H3.3 in various induced cell fate changes. a Schematics of the transdifferentiation process indicating the time-points at which chromatin was collected for preparing H3.3 ChIP-Seq libraries. b Venn diagram revealing the number of uniquely and commonly bound genes among day 0 H3.3, day 4 H3.3 and iHP H3.3. c Bar chart revealing the significantly enriched biological processes for genes which are bound by H3.3 on day 4 and in iHP (dark grey) and those bound by H3.3 at day 0 and day 4 (orange). X-axis represents the enrichment score of the hypergeometric enrichment test. d Schematics of the knockdown experiment (top). The bar charts below represent the number of cobblestones formed (left) and CFU numbers (right), observed in wells in which the knockdown of the H3.3 had been performed. Non-targeting siRNA constructs (siNT) were used as controls. The images above the bar charts are representative images of the wells in which the counting took place. Scale bars equal 100 µm. Values are mean ± s.e.m from independent replicate experiments (n = 3). Two-tailed t-test was used for statistical analysis. Error bars represent standard deviation. e Bar chart demonstrating the level of expression of the indicated genes at day 1 and day 2 of the induced neuronal differentiation after the knockdown of H3.3 (siH3.3). Non-targeting siRNA (siNT) were used as controls. Y-axis represents the fold change over control sample. *p-value <0.05. Two-tailed t-test was used for statistical analysis. Error bars represent standard deviation (n = 3). f Bar chart demonstrating the level of expression of the indicated genes at day 4 and day 6 of the induced differentiation to neuronal lineage after the knockdown of H3.3 (siH3.3). Non-targeting siRNA (siNT) were used as controls. Y-axis represents the fold change over control sample. *p-value <0.05. Two-tailed t-test was used for statistical analysis. Error bars represent standard deviation (n = 3)

