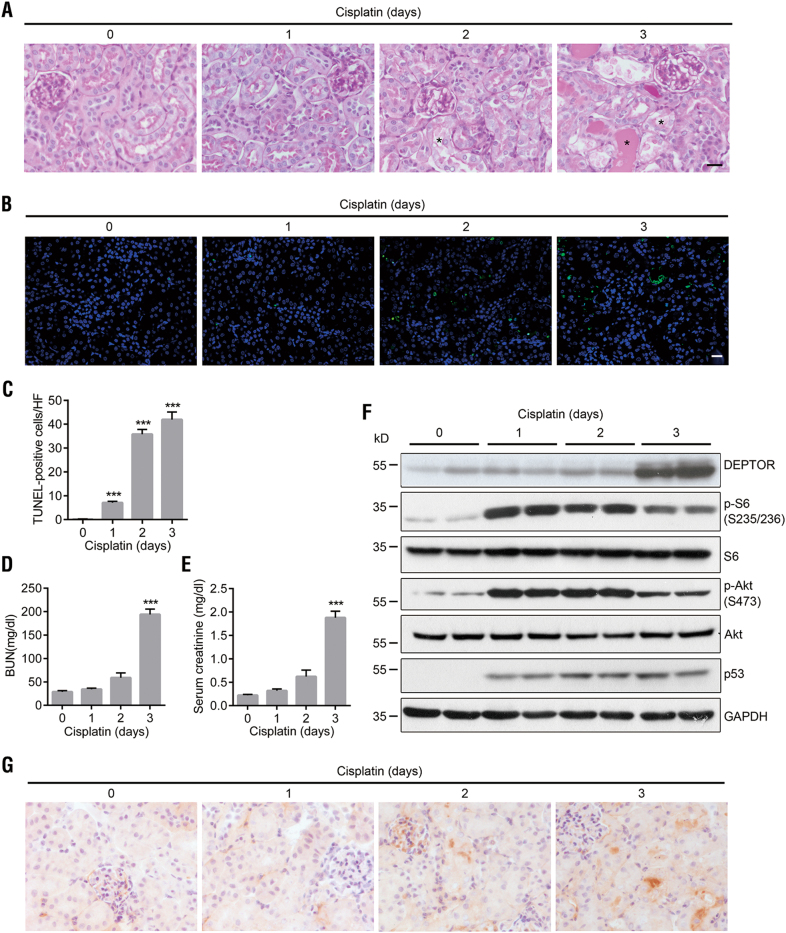
Fig. 1. Induction of DEPTOR expression in proximal tubules by cisplatin.
a Kidney histology in 8-week-old C57BL/6 mice on days 0–3 after intraperitoneal injection with cisplatin (a single dose of 20 mg/kg), detected with PAS staining. The asterisks indicate tubules with necrosis and cast formation. b Renal cell apoptosis was assessed with a fluorometric TUNEL assay (green). Nuclei were stained with DAPI (blue). c Quantitative data for apoptotic cells. Data are expressed as the number of TUNEL-positive cells per high-magnification field (HF, ×400). d Assessment of BUN and (e) serum creatinine levels. f Western blotting of p-S6 (S235/S236), p-Akt (S473), and p53. Protein samples were extracted from the renal cortex. g IHC staining of DEPTOR. Scale bar = 20 μm. Bars indicate mean values ± SEM. n = 6. ***P < 0.001 compared with day 0

