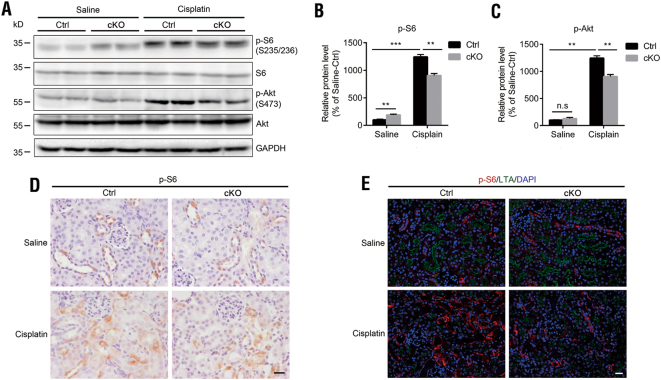
Fig. 4. Expression of p-S6 (S235/S236) and p-Akt (S473) in control and DEPTOR cKO kidneys after cisplatin-induced AKI.
a Western blotting of p-S6 (S235/S236) and p-Akt (S473) in the kidneys of cKO and control mice after cisplatin treatment. b Quantification of p-S6 and (c) p-Akt in the results of (a). Protein levels were normalized against GAPDH. Bars indicate mean values ± SEM. n = 5. **P < 0.01; ***P < 0.001; n.s., no significant difference. d IHC staining of p-S6 in cKO and control kidneys after cisplatin treatment. Scale bar = 20 μm. e Co-immunofluorescent staining for p-S6 and LTA in the kidneys of cKO and control mice after cisplatin treatment. Nuclei were stained with DAPI (blue). LTA, Lotus tetragonolobus lectin, is a marker of proximal tubules. All samples were from the mice on day 3 after cisplatin treatment. Scale bar = 50 μm

