Figure 1.
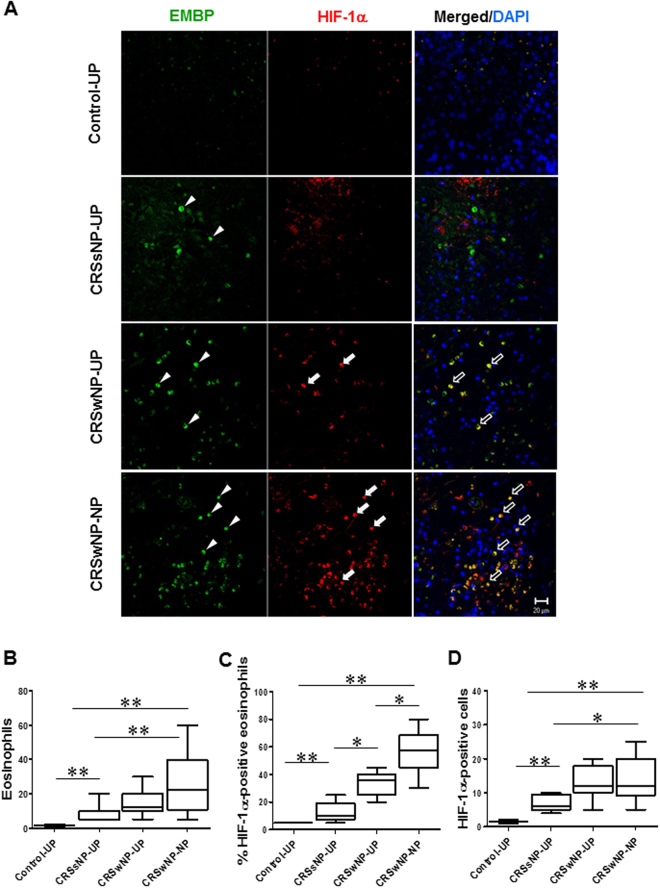
Fluorescence micrographs of HIF-1α expression and distribution of EMBP in nasal mucosal tissue. (A) Confocal images show colocalization of HIF-1α and EMBP (black arrows) in nasal mucosal tissue from control subjects and patients with CRSsNP, a patient with CRSwNP, and a NP sample. White arrowheads indicate EMBP-positive and arrows show HIF-1α-positive cells. Cell nuclei were counterstained by DAPI (4′,6-diamidino-2-phenylindole). (B–D) Distribution of eosinophils and percentage of HIF-1α-positive cells in nasal mucosal tissue. The number of HIF-1α- positive cells was considerably higher in the NP tissues of the CRSwNP group compared to the other groups. Data are expressed as the means ± SD. *P < 0.05, **P < 0.01. Mann-Whitney U test. Scale bar = 20 μm.

