Figure 6.
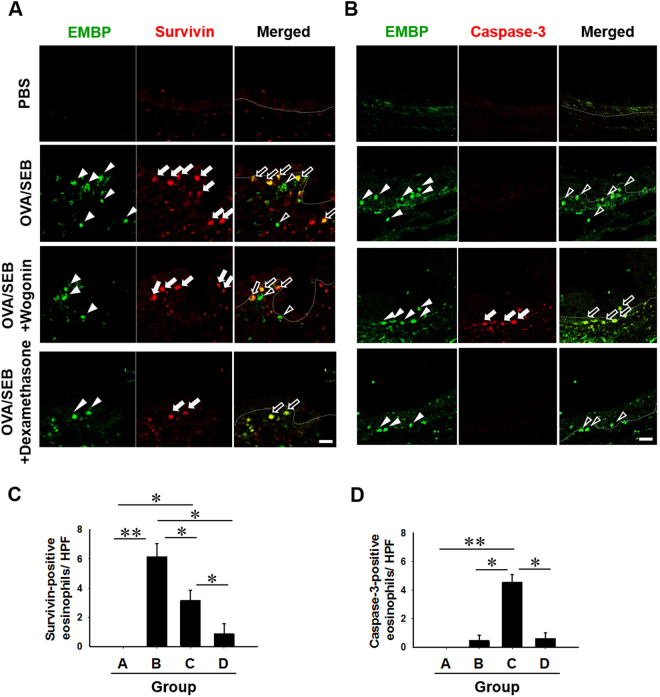
Fluorescence micrographs of EMBP, survivin, and caspase-3 positive cells in the mouse polyp model. (A) Representative photographs of survivin-positive and (B) caspase-3-positive eosinophils. (C) and (D) Quantitative analysis of survivin and caspase-3 -positive eosinophils. Dotted lines represent the border between respiratory epithelium and submucosa. Arrowheads denote EMBP-positive cells in each group of mice. White arrows denote survivin-positive cells in A and caspase-3-positive cells in B. Data are expressed as the mean ± SD. *P < 0.05, **P < 0.01. Mann-Whitney U test. Scale bar = 10 μm.

