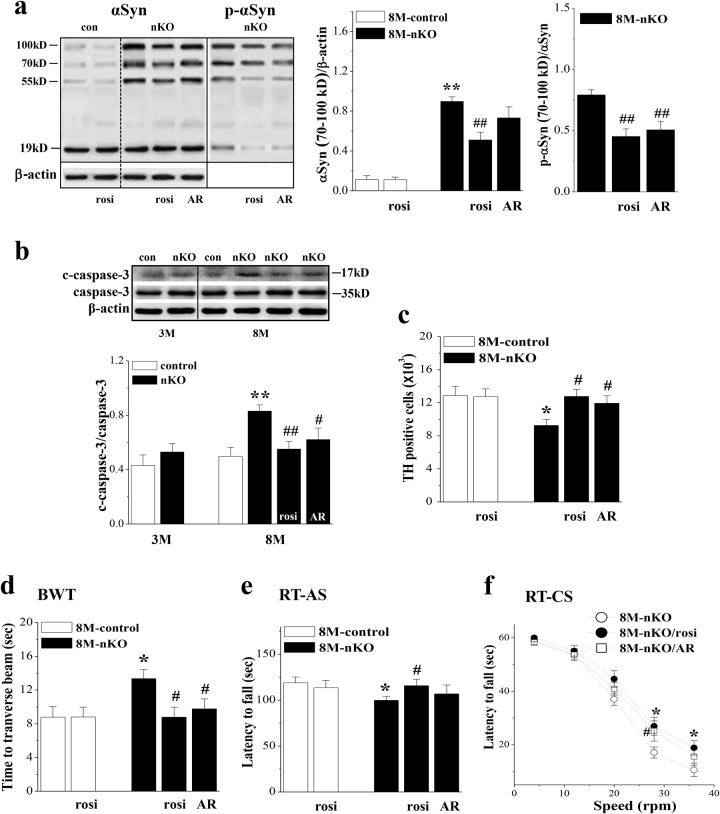
Fig. 5. Effects of rosiglitazone and AR-A014418 on accumulation and phosphorylation of αSyn and impairment of dopaminergic neurons and motor coordination.
a Bar graph shows the densitometric values of αSyn oligomers and phosphorylation of αSyn oligomers (p-αSyn) in SN of 8-M-old control and seipin-nKO mice treated with rosi or AR-A014418 (AR) for 28 days. **P < 0.01 vs. control mice; ##P < 0.01 vs. seipin-nKO mice (two-way ANOVA). The data of β-actin in αSyn oligomers and phosphorylation of αSyn oligomers are the same. b Level of cleaved caspase-3 (c-caspase-3) in SN of 3-M-old and 8-M-old control mice and seipin-nKO mice treated with rosi or AR. **P < 0.01 vs. control mice; #P < 0.05 and ##P < 0.01 vs. 8-M-old seipin-nKO mice (three-way ANOVA). c Bar graph indicates the number of TH-positive cells in SNpc of 8-M-old control mice and seipin-nKO mice treated with rosi or AR. *P < 0.05 vs. control mice; #P < 0.05 vs. seipin-nKO mice (two-way ANOVA). d, e Bar graphs show the time (s) to traverse the beam in BWT and the latency (s) in RT-AS. *P < 0.05 vs. control mice; #P < 0.05 vs. seipin-nKO mice (two-way ANOVA). f Each point represents the latency in RT-CS. *P < 0.05 (seipin-nKO mice treated with rosi) and #P < 0.05 (seipin-nKO mice treated with AR) vs. seipin-nKO mice (repeated measures ANOVA)

