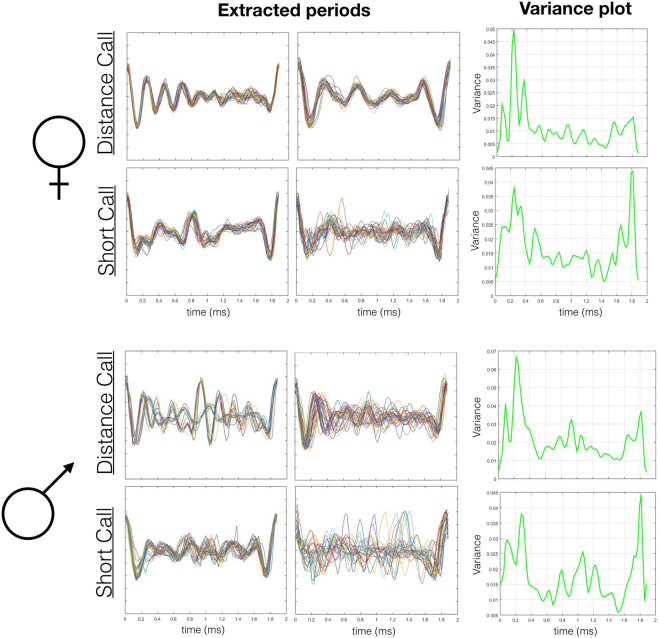
Figure 2.
In the first two columns, each panel depicts 10 overlaid periods extracted from a single call. Each row is a different call type within females and males. Additionally, the third column plots variance in period structure across time. Each variance plot is based on up to 20 periods extracted from 9 different calls from 3 different individuals. Note that the y axes for the variance plots differ. There was the most variance for male distance calls (y-max = 0.07).

