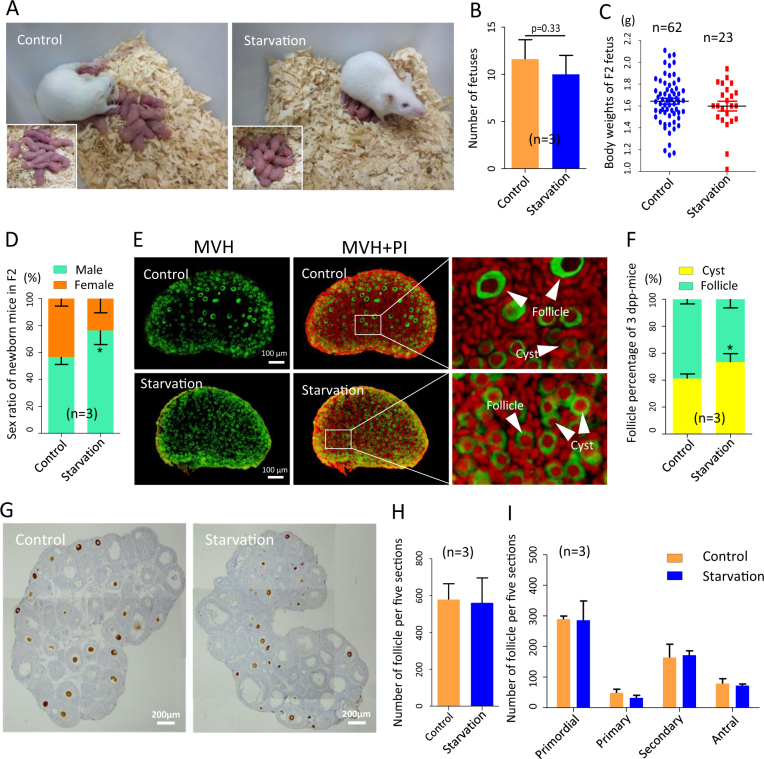
Fig. 9. Analysis of folliculogenesis F2 offspring of starved pregnant mothers.
a Photograph of F2 offspring of control and starved mothers. b Litter size of F1 mothers. c Body weight of F2 fetus at 0 dpp. d Sex ratio of F2 offspring. e, f MVH-positive oocytes (green) in cysts (white arrows) or in primordial follicles (white arrows) in 3 dpp ovaries. g–i Quantification of the number of follicles and percentages of different classes of follicles in 21 dpp ovaries from control and F2 offspring of starved ovaries; n = number of ovaries or fetuses (c) or independent repeats (b, d) used for the analyses. *P < 0.05

