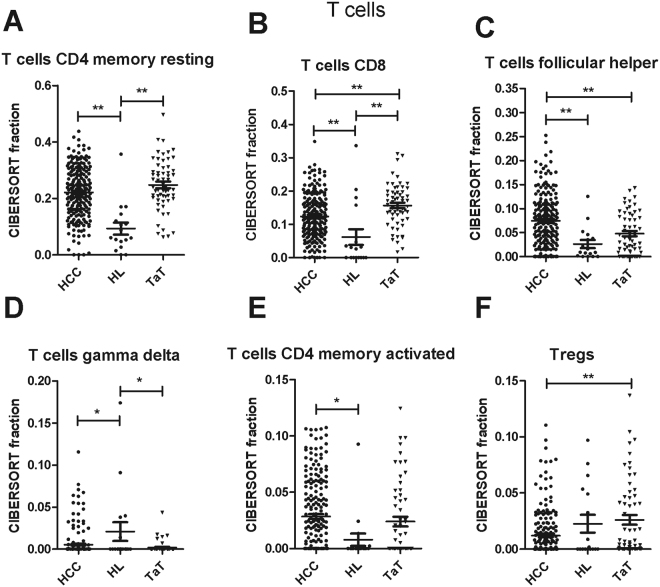
Figure 2.
T cell subfractions in human HCC tumor tissue (HCC), adjacent tissue (TaT) and healthy liver. (HL). CIBERSORT immune cell fractions were determined for each patient; each dot represents one patient. Mean values and standard deviations for each cell subset including CD4 memory resting cells (A), CD8 cells (B), follicular helper (C), T cells gamma delta (D), CD4 memory activated (E) and Tregs (F) were calculated for each patient group and compared using one-way ANOVA. *p < 0.05; **p < 0.01.

