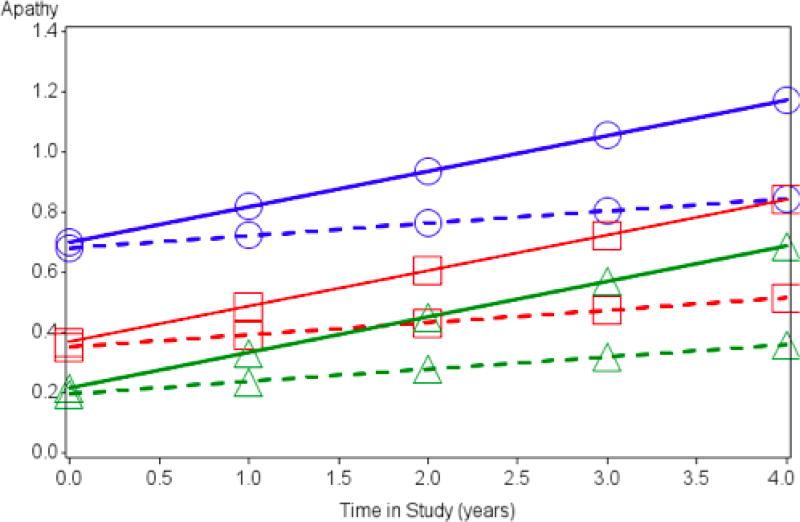
Figure 2.
Results from Longitudinal Model. Apathy (NPI-Q apathy item scores) as predicted by the fixed effects predictors supramarginal FDG metabolism and diagnostic groups from the longitudinal model across time (in years). The fixed effects model shows a longitudinal positive association between hypometabolism and rate of progression of apathy over time. For purposes of the graph, other covariates in the model were set at the values: FDG metabolism in the posterior cingulate =1 (mean); sex = male; Antidepressant medication = yes (presence of antidepressant medication). Circles = AD dementia; squares = MCI; triangles = CN. Solid line = low FDG metabolism for the supramarginal gryus (1 standard deviation below the mean); Dashed line = high FDG metabolism for the supramarginal gryus (1 standard deviation above the mean). NPI-Q: Neuropsychiatric Inventory Questionnaire; FDG: 18F-fluorodeoxyglucose; AD: Alzheimer’s disease; MCI: mild cognitive impairment; CN: cognitively normal.

