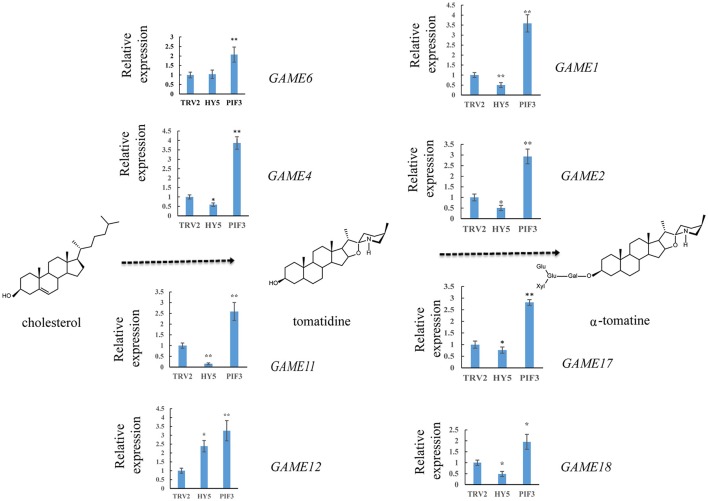
Figure 3.
Relative expression levels of glycoalkaloid pathway genes in leaves following infiltration with different constructs. A schematic view of the SGA biosynthetic pathways. Dashed arrows represent multiple biosynthetic reactions. Graphs next to each gene name show expression levels determined by qRT-PCR, normalized to the Actin housekeeping gene and to the mock-infected control. Data are mean ± standard deviation of three biological replicates. Asterisks indicate a significant difference from the control according to Student's t-test (**P < 0.01 and *P < 0.05).

