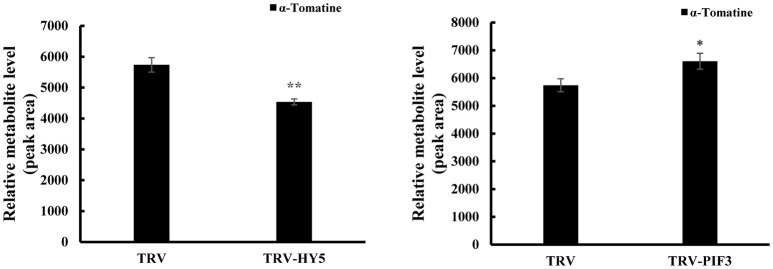
Figure 4.
Changes in HY5 and PIF3 expression in tomato leaves results in altered levels of the predominant SGAs. Levels of a-tomatine in leaves determined by UPLC-MS/MS. Tomatine was identified by comparison of its retention time and mass spectrum to those generated for authentic standards analyzed on the same instrument. Relative metabolite levels are expressed as ratios of peak areas. Values represent means ± standard deviation (n = 3). Student's t-test was used to assess whether the results with the virus-induced gene silencing plants differed significantly from those for TRV-infected plants (*P < 0.05; **P < 0.01).

