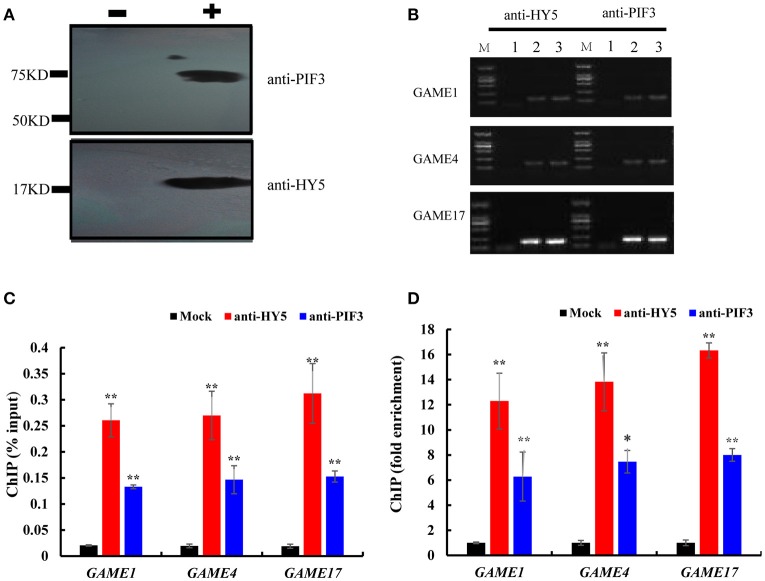
Figure 7.
- Chromatin extract precipitated without antibody (mock).
- Chromatin extract (input).
- ChIP with antibodies (anti-HY5 and anti-PIF3, respectively). Analyzed target genes are listed to the left of the corresponding images.
(C) The input percentages derived for different antibodies. The columns represent the average input percentage from three independent experiments. (D) Quantification of ChIP analysis corresponding to images presented in (C). Ordinates show the fold difference.

