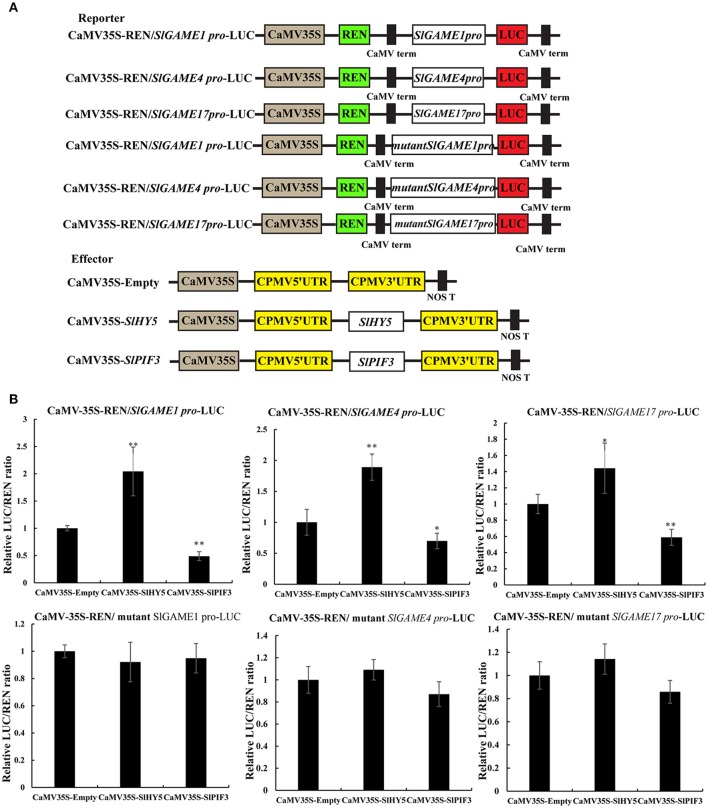
Figure 8.
Transient expression analysis of the transcriptional activity of SlPIF3 and SlHY5. (A) Schematic representation of the double reporters and effector plasmids used in the assay. (B) Transcriptional activation ability of SlHY5 and transcriptional repression ability of SlPIF3 in tomato leaves. Each value represents the means ± standard deviation (n = 6). Asterisks indicate significant differences in values (*P < 0.05; **P < 0.01; Student's t-test).

