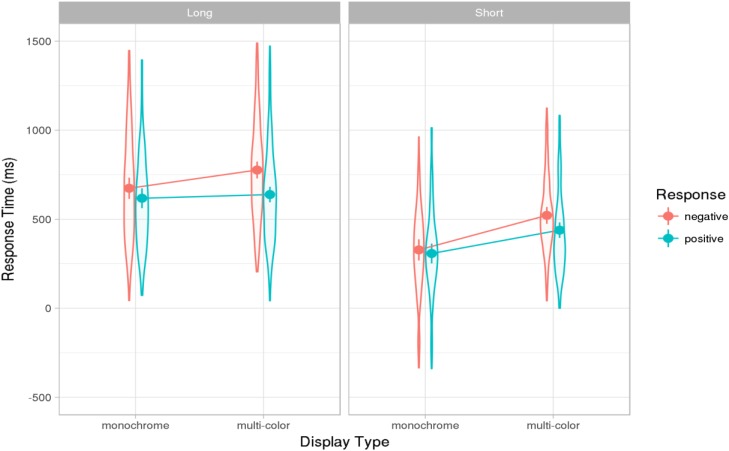
FIGURE 3.
Results of Experiments 2: Effect estimates (grand-mean response latencies computed from the mixed model, ms) for long and short positive and negative responses in monochrome and multi-color displays. Error bars show 83% confidence intervals; non-overlap indicates significance of the difference at the 5% level (see text). Violin-plot overlay indicates the distribution of the data included in the analysis.

