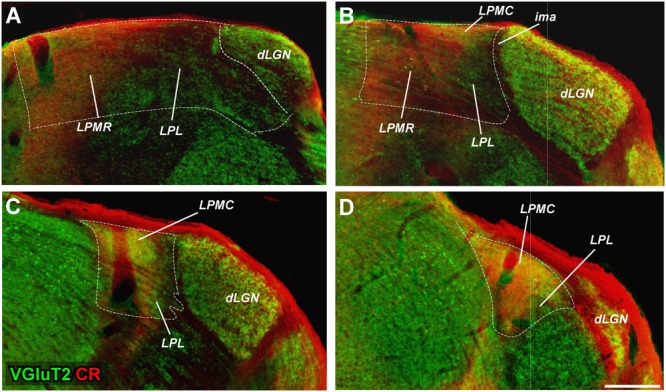
FIGURE 2.

Delineation of LP subdivisions from the overlay of VGluT2 and CR immunostaining images. (A–D) Images from adjacent sections immunostained, respectively, for VGluT2 and CR immunolabeling (colored in red and green, respectively) are overlaid. This analysis reveals that LPMR is VGluT2-poor and CR-rich (red in the merged images), LPL is VGluT2 and CR-poor (green), and LPMC is both VGluT2 and CR rich (yellow).
