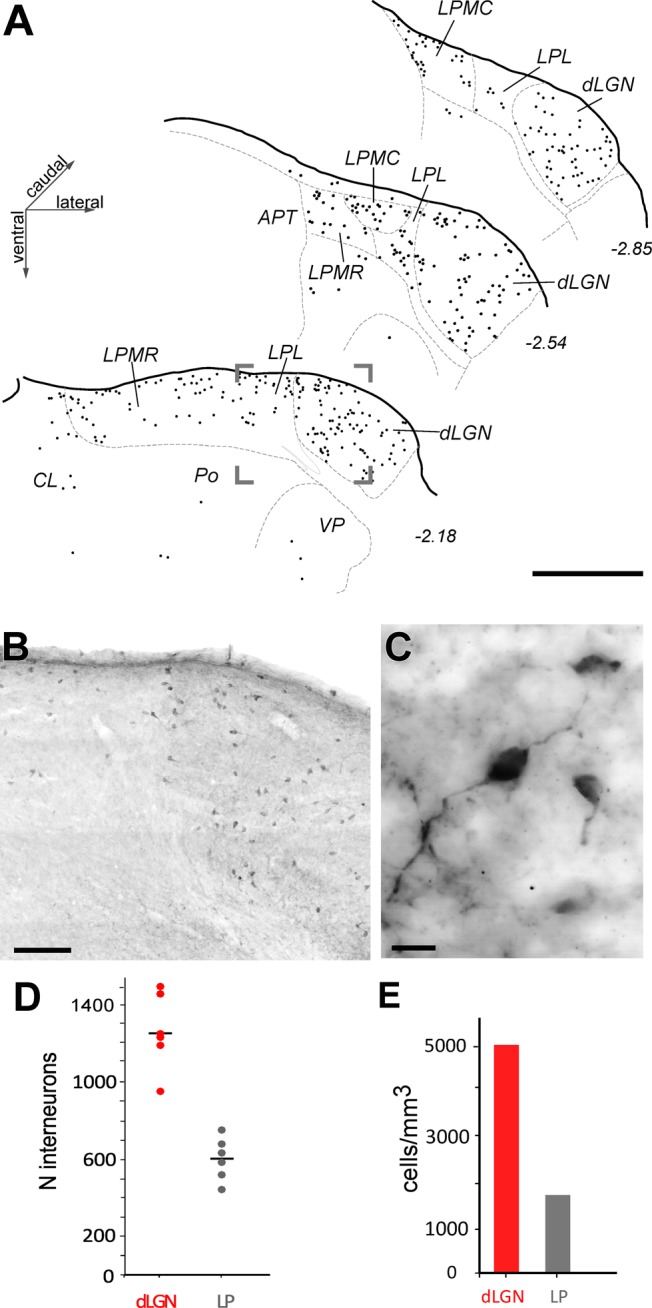
FIGURE 5.

Distribution and number of GABAergic interneurons in the visual thalamic nuclei. (A) Camera-lucida drawings of three coronal sections of the visual thalamus. GABA-immunolabeled cells are indicated by black dots; each dot represents a cell. (B) Low-magnification image taken from the area indicated by a frame in (A). (C) High magnification image showing three immunostained cells displaying typical interneuronal size and morphology. Scale bars: (A) = 500 μm; (B) = 50 μm; (C) = 10 μm. (D,E) GABAergic neuron number (D) and density (E) estimations.
