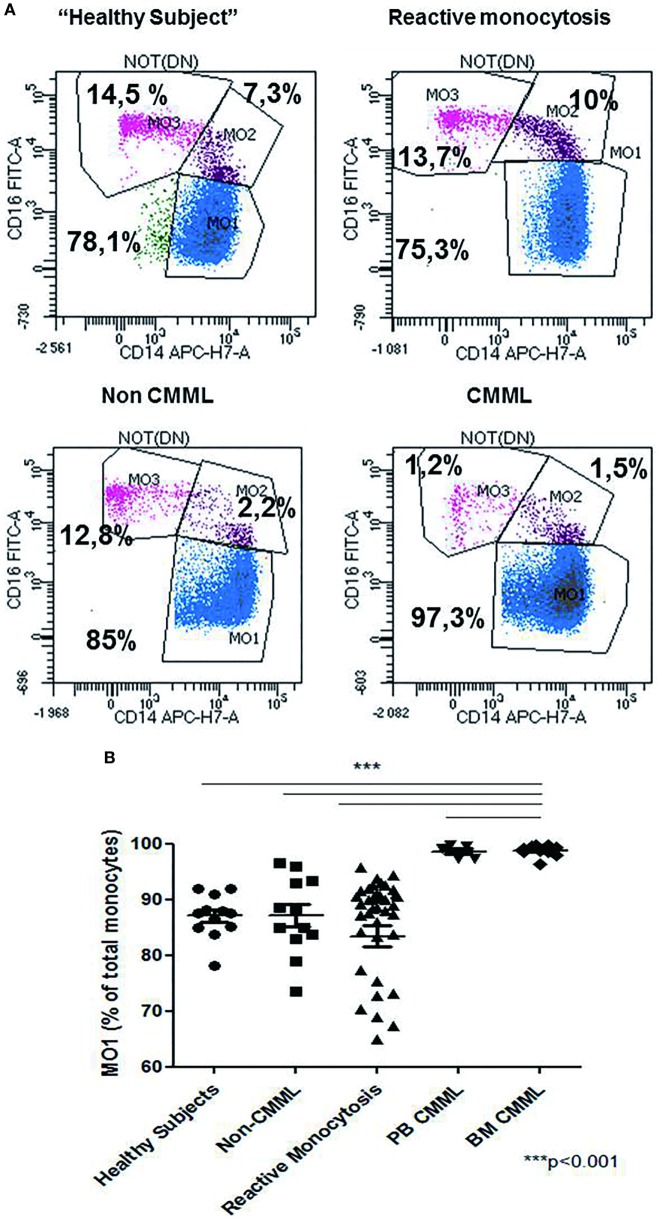
Figure 2.
Repartition of monocytes subsets in different groups of cases. Monocyte subset repartition in distinct groups [n = 12 “healthy subjects,” n = 15 chronic myelomonocytic leukemia (CMML), n = 36 reactive monocytosis, n = 12 hematological diseases or non-chronic myeloid leukemia (CMML) (n = 1), MDS (n = 2), AML (n = 4), myeloma (n = 1), and myeloproliferative syndromes (n = 4)]. For each group, the monocytes subsets expressed as percentage of total monocytes are displayed (A). Relative frequencies of the MO1 subset in different groups (n = 12 “healthy subjects,” n = 12 non-CMML, n = 36 reactive monocytosis >1 × 10⁹, n = 5 peripheral blood CMML, and n = 10 bone marrow CMML) (B). Fisher test was performed in order to compare each group of cases with healthy subjects. ***p < 0.001.

