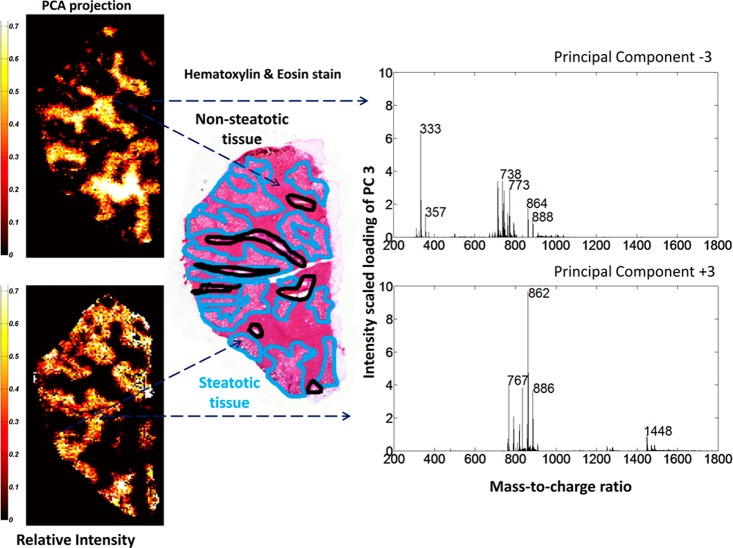
Figure 2.
Molecular classification of liver tissue by PCA of the MALDI-TOF-MSI data in negative-ion mode. Projection of PCA loading (PC3) from a representative tissue section delineates nonsteatotic (top, PC–3) and steatotic (bottom, PC+3) regions. Ion images are scaled to relative intensity. These regions correspond well to histological annotations (middle). Molecular intensity-scaled loading spectra of the PC function show unique molecular mass profiles for each tissue region. Note that PC–3 is shown with absolute values for easier interpretation.

