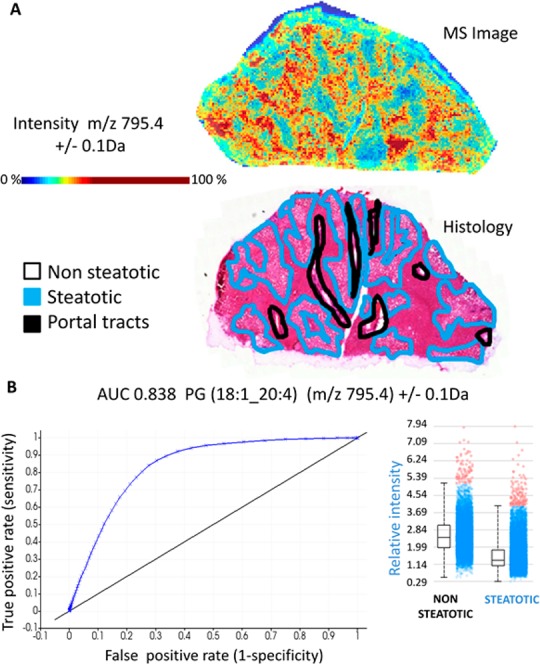
Figure 3.

Preferential tissue distribution and high predictive value of phosphatidylglycerol (18:1_20:4) to steatotic regions. (A) MS ion image (top) of PG(18:1_20:4) (m/z 795.4) alongside the annotated histological image (bottom) of the same tissue section reveals preferential localization to steatotic areas. Color scale is in relative intensity. (B) Receiver operating characteristic (ROC) analysis of PG(18:1_20:4) shows high discriminatory power with AUC of 0.838. Inset, the relative ion intensity of PG(18:1_20:4) shows higher abundance in steatotic compared to nonsteatotic tissue regions (pixels). The horizontal line denotes the average value, the box indicates the 95% confidence interval, and the bars signify the standard deviation.
