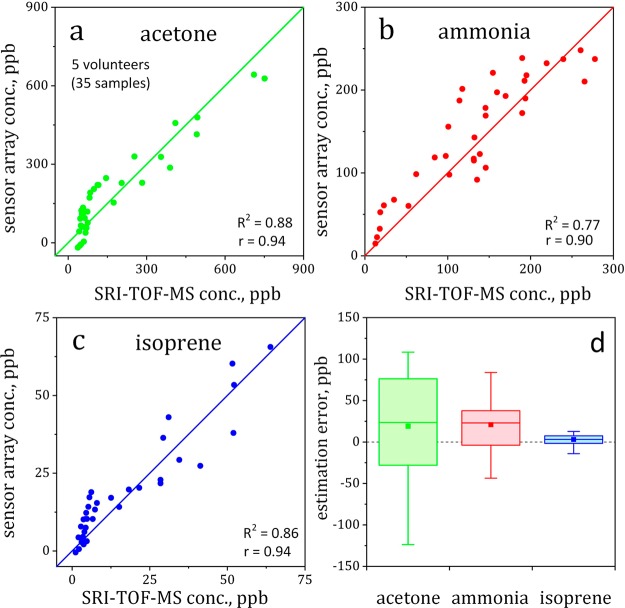
Figure 4.
Scatter plots indicating correlations between sensor array and SRI-TOF-MS for acetone (a), ammonia (b), and isoprene (c) along with their corresponding Pearson’s correlation coefficients (r) and coefficients of determination (R2). (d) Box-and-whisker plot of sensor array estimation errors. Medians and means are shown as lines and squares, respectively. The boxes represent the first and third quartiles and whiskers indicate the full ranges.

