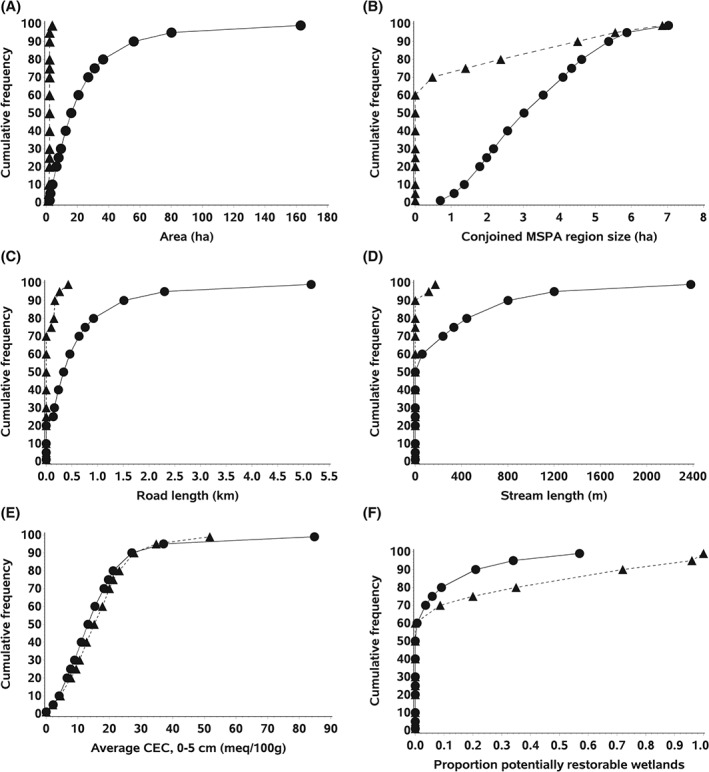
Figure 3.

Cumulative frequency distributions for candidate (•) and null sites (Δ) for (A) area, (B) conjoined MSPA region size (log10), (C) road length, (D) stream length, (E) average cation exchange capacity (CEC) in the top 5 cm of soil, and (F) proportion of potentially restorable wetlands. The panel B x‐axis is formatted as 10x, where the displayed values equal x. Symbols represent percentiles 1, 5, 10, 20, 25, 30, 40, 50, 60, 70, 75, 80, 90, 95, and 99, but some may be obscured due to overprinting.
