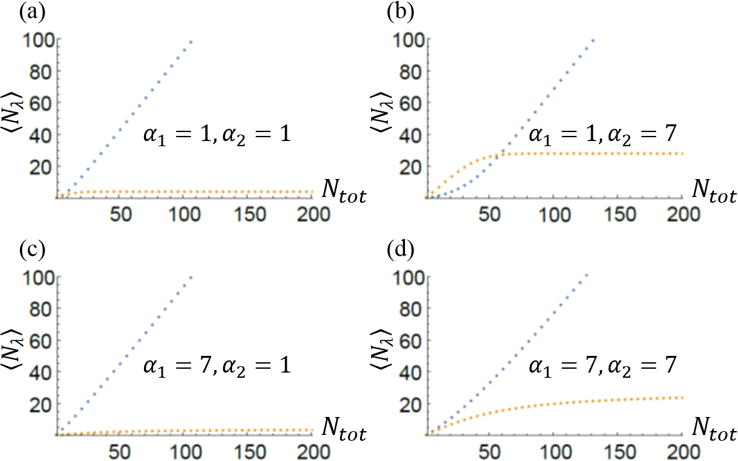
Fig. 4.

Mean sizes of two multi-filament structures competing for the same monomer pool. Blue line corresponds to structure one with κD,1 = 4, and the orange line is associated with structure two with κD,2 = 5. In all plots (a)–(d) we see that as Ntot increases 〈N1〉 becomes linear in Ntot while 〈N2〉 appears to approach a constant value. Changing the number of filaments in either structure (αλ) appears to affect how quickly the large Ntot behavior sets in. Larger values of αλ seem to push the large Ntot limit toward higher values of Ntot. Comparing (a) and (c) with (b) and (d) we also conclude that increasing α2 increases the final value of 〈N2〉 as Ntot becomes very large. It also appears that the increase in linear; for Ntot = 200 in (a) 〈N2〉 = 4 while in (b) at Ntot = 200 〈N2〉 = 28. This is a seven-fold increase in structure size as α2 goes from one to seven. This trend holds true for all values of α2 between one and seven.
