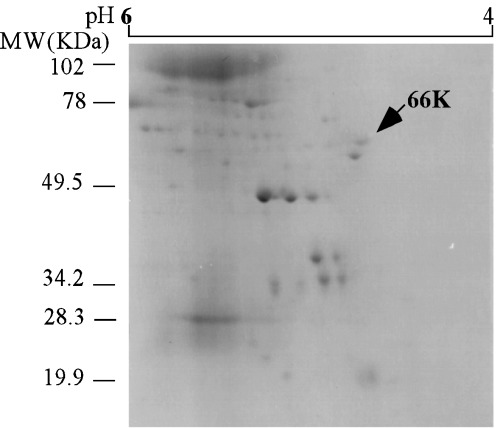
Figure 2.

2‐D gel electrophoresis of pH 5 fraction of sucrose density gradient isoelectric focusing. The arrow on the photograph indicates the 66 kDa protein. Bars on the left side of photograph show molecular weight standards. Bar on the top of photograph shows the isoelectric point range.
