
Figure 3. Growth of filaments from two inequivalent nucleating centers in a limiting pool of monomers.
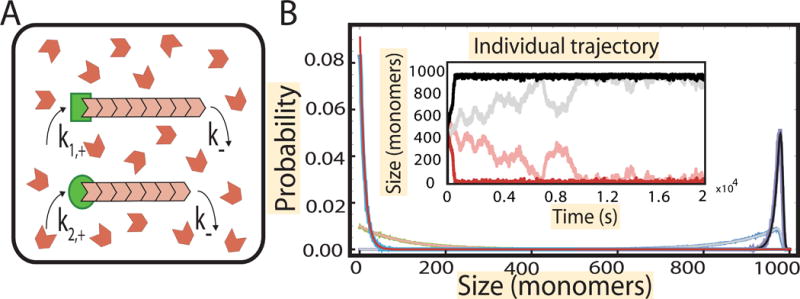
(A) Schematic showing the growth of filaments (pink) from two distinct nucleating centers (green) in a pool of monomers (in red). (B) (Inset) Numerical simulation of the growth trajectory of the filaments from the nucleating centers. Shown are trajectories for 10% difference in assembly rate (dark) and 1% difference (light). After a growth phase, where both filaments accrue monomers, the faster growing filaments attains a steady state by taking up most of the free monomers, while the slower filament shrinks. The faster growing filament attains a peaked distribution of size (black) and the slower one attains a geometric distribution (red). The parameters used are , , , k− = 10 s−1, N = 1000 and Nfree = N − l1 − l2, is the number of free monomers in solution and l1 and l2 are the lengths of the two filaments. The simulations are overlaid on the results obtained analytically (blue and green) in STAR Methods, section “Gamma function representation of two filaments”.