Figure 1.
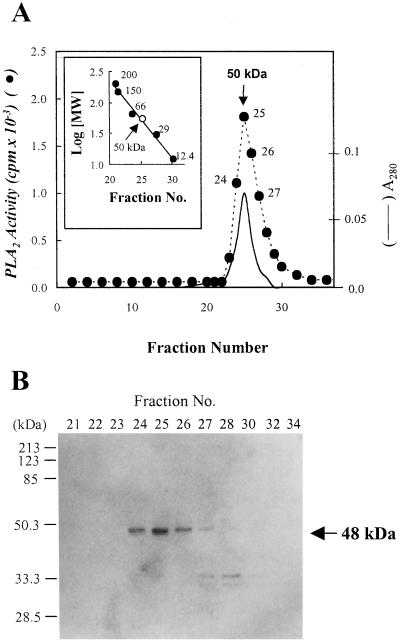
Gel filtration column chromatography on Superose 12 FPLC. The active fractions obtained from Mono Q FPLC column were applied to a Superose 12 gel filtration FPLC column as described in “Materials and Methods.” The inset shows the calibration curve for the estimation of the apparent molecular mass of the PLA2. The standard protein markers for the gel filtration chromatography were as follows: β-amylase (200 kD), alcohol dehydrogenase (150 kD), BSA (66 kD), carbonic anhydrase (29 kD), and cytochrome c (12.4 kD) (A). The active fractions from Superose 12 gel filtration FPLC columns were analyzed by 12% (w/v) SDS-PAGE and visualized by silver stain as described in “Materials and Methods.” The standard protein markers were as follows: myosin (200 kD), β-galactosidase (116 kD), phosphorylase b (97.4 kD), BSA (66.2 kD), ovalbumin (45 kD), carbonic anhydrase (31 kD), and trypsin inhibitor (21.5 kD). The molecular mass (arrow) of the plant PLA2 was extrapolated from Rf value (B). Essentially identical results were obtained in three independent experiments.

