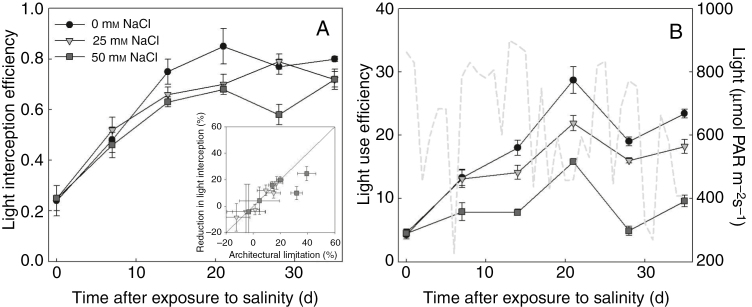
Fig. 3.
Influence of salinity on (A) light interception efficiency (eqn 9A, unitless) and (B) light use effiency (eqn 9B, µmol CO2 mmol−1 photon). The light grey dashed line in B represents the daily average light environment outside the greenhouse condition, which was used for simulation. The inset in A shows the relationship between architectural limitation and reduction in light interception efficiency (n = 3, each replication represents the average value of 10 simulations). The solid line in the inset represents a 1^:^1 line.

