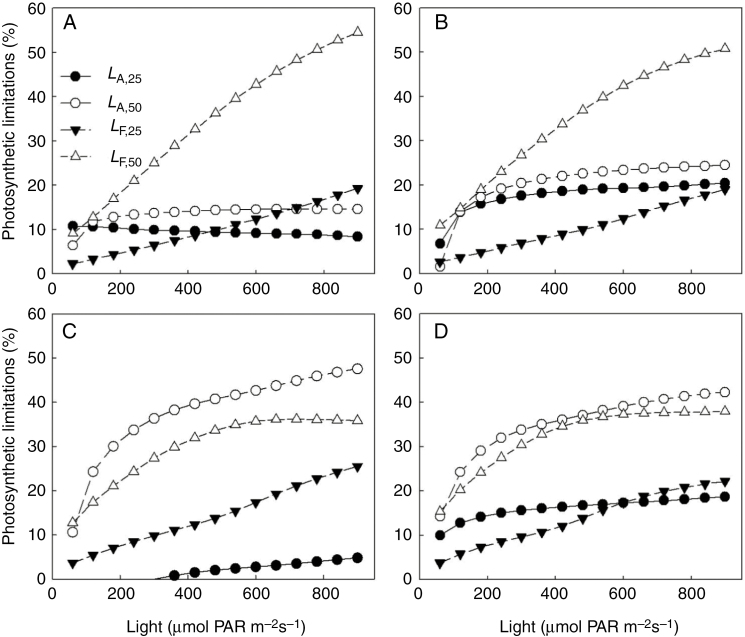
Fig. 4.
Simulated dependencies of architectural and functional limitations (LA,x and LF,x in eqn 8, respectively) to light environment above the canopy on (A) 14, (B) 21, (C) 28 and (D) 35 d after salinity treatments. Closed symbols and open symbols represent 25 and 50 mm NaCl salinity, respectively. All values represent the average from three replicates.

