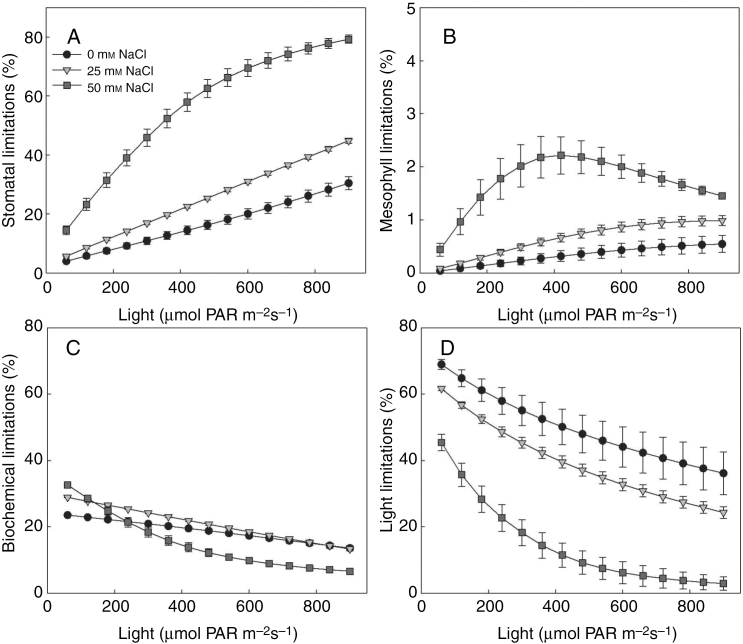
Fig. 6.
Dependencies of (A) stomatal, (B) mesophyll, (C) biochemical and (D) light limitation to light environment above the canopy under different salinity levels (circles, reverse triangles and squares represent additional 0, 25 and 50 mm NaCl in the nutrient solution, respectively) on day 21 after exposure to salinity, leaf rank = 15 (n = 3, each replication represents the average value of 10 simulations). Similar dependencies of other leaf ranks can be found in Supplementary Data Fig. S5.

