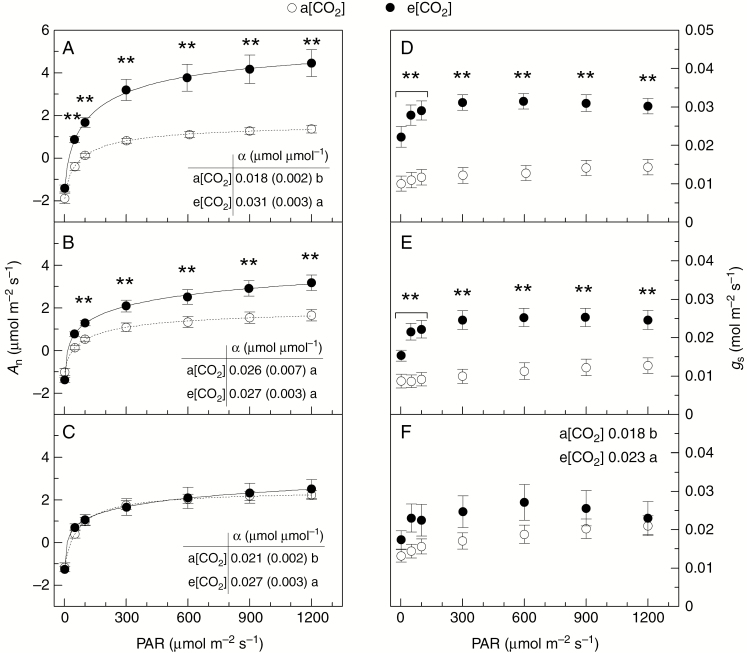
Fig. 3.
Light response curves of leaf CO2 assimilation (An, in A–C) and stomatal conductance (gs, in D–F) in field-grown coffee trees under actual (a[CO2]) and elevated (e[CO2]) air CO2 concentration. Apparent quantum efficiency (α) is shown in (A) and (C). Measurements were taken in three canopy layers: 0–50 cm (L1, in C, F); 50–100 cm (L2, in B, E); >100 cm (L3, in A, D). Each symbol is the mean value of 10–17 replications (± s.e.). ** and different letters (in F) indicate statistical difference between [CO2] treatments at at P < 0.01.

