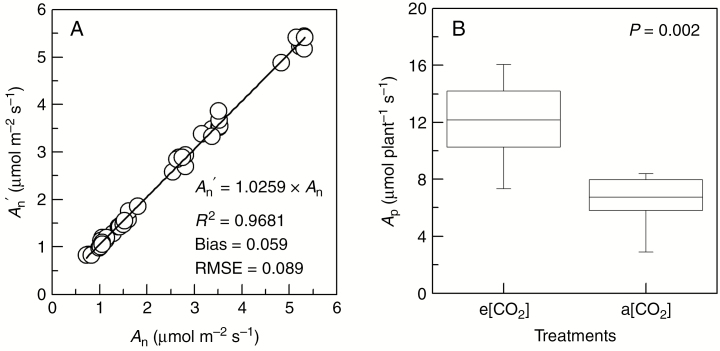
Fig. 7.
Comparison between estimated (An′) and measured (An) leaf net photosynthesis (in A) and whole-plant photosynthesis (AP, in B) of Arabica coffee computed under VegeSTAR from mock-ups produced in VPlants, integrating the hours of the most intensive daily assimilation. In (A), the root mean square error (RMSE), the R2, the bias and the 1:1 line are indicated. In (B), minimum, first quartile, median, third quartile and maximum values of AP, and the P-value of ANOVA (n = 8) are shown. Plants were cultivated under elevated (e[CO2]) and actual (a[CO2]) air CO2 concentration environments. Estimations were done for the fourth cold-dry season (31 July 2015).

