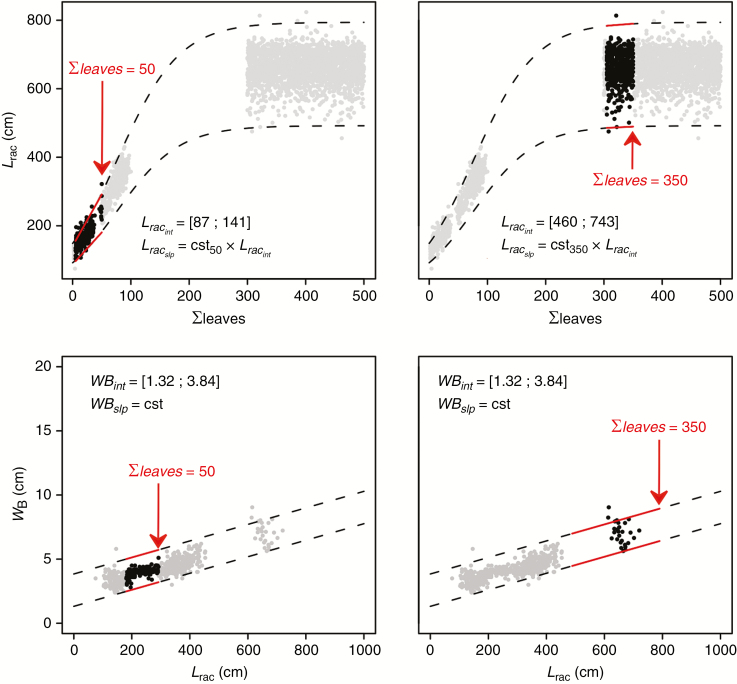
Fig. 2.
Parameter range variations (dotted lines) and observations (points) over plant development. Rachis length (Lrac) follows a logistic curve and was modelled as a succession of linear relationships with plant development. Parameters of these linear relationships are the intercept (Lracint) and the slope (Lracslp), the latter being expressed as a product of Lracint and a constant that depends on the stage considered (cst50, cst150, …). Leaflet maximum width at point B (WB) was expressed as a linear function of rachis length (WB = WBint + Lrac×cst, cst being the average slope fitted against field observations). Solid lines delimit the range for a given age and black points represent the observations carried out at the corresponding age.

