Abstract
Background and Aims
Failure to account for the variation of kernel growth in a cereal crop simulation model may cause serious deviations in the estimates of crop yield. The goal of this research was to revise the GREENLAB-Maize model to incorporate source- and sink-limited allocation approaches to simulate the dry matter accumulation of individual kernels of an ear (GREENLAB-Maize-Kernel).
Methods
The model used potential individual kernel growth rates to characterize the individual potential sink demand. The remobilization of non-structural carbohydrates from reserve organs to kernels was also incorporated. Two years of field experiments were conducted to determine the model parameter values and to evaluate the model using two maize hybrids with different plant densities and pollination treatments. Detailed observations were made on the dimensions and dry weights of individual kernels and other above-ground plant organs throughout the seasons.
Key Results
Three basic traits characterizing an individual kernel were compared on simulated and measured individual kernels: (1) final kernel size; (2) kernel growth rate; and (3) duration of kernel filling. Simulations of individual kernel growth closely corresponded to experimental data. The model was able to reproduce the observed dry weight of plant organs well. Then, the source–sink dynamics and the remobilization of carbohydrates for kernel growth were quantified to show that remobilization processes accompanied source–sink dynamics during the kernel-filling process.
Conclusions
We conclude that the model may be used to explore options for optimizing plant kernel yield by matching maize management to the environment, taking into account responses at the level of individual kernels.
Keywords: Individual kernel filling, model, remobilization, source–sink dynamic, Zea mays
INTRODUCTION
Yield increase is one of the main goals of agricultural research. The most important yield components of cereal crops include the number of plants per unit area, the number of kernels per plant and the individual kernel weight (KW; Smith and Hamel, 1999). Although the number of kernels per unit area is the dominant component for yield, a wide range in yield levels can be achieved due to the variation in individual KW (Hanft et al., 1986; Borras et al., 2004; Cárcova and Otegui, 2007). Therefore, understanding the physiological mechanisms of the growth of individual kernels will help to optimize field management strategies for maximizing crop yield.
Although kernel yield is positively correlated with the photosynthetic supply, the kernel sink capacity is also important for determining the assimilates used by kernels related to the genotypic characteristics and environmental effects (Reddy and Daynard, 1983; Jones et al., 1996). If the kernel sink capacity established before grain filling is small, high KW will not be achieved even if the assimilate supply is high during the grain-filling stage. The non-structural carbohydrates in the reserve organs are another important source to support kernel growth, especially in the stress generated by the demands of photosynthesis (Andrade and Ferreiro, 1996), and the stem is the main reserve organ for maize (Barnett and Pearce, 1983). It has been observed that the stem dry weight fluctuated when the source–sink ratio was greatly modified during kernel growth (Tollenaar and Daynard, 1982; Martinez-Carrasco et al., 1993). The leaves and other ear organs such as the husk, shank and cob can also remobilize carbohydrates (Crawford et al., 1982).
Crop simulation models integrate the key processes of crop development and growth, and are capable of predicting the growth dynamics and the final yield of plants on the field scale (Boote et al., 2013). CERES-Maize is one of the most widely used crop simulation models for maize (Jones and Kiniry, 1986; Jones et al., 2003). Final kernel yield is the product of the number of kernels multiplied by the daily kernel growth rate. Daily kernel growth rate is calculated from the potential kernel growth rate and is affected by temperature, water and nitrogen (Hoogenboom et al., 2010; Lizaso et al., 2011). A similar procedure is adopted in the APSIM-maize (Keating et al., 2003) and Hybrid-maize models (Yang et al., 2004).
Another modelling approach is based on the functional–structural plant model (FSPM). The FSPM integrates plant architecture and assimilate production and partitioning at the organ level, and is capable of simulating the interactions between the structure and function of the organs (Vos et al., 2010; Sievanen et al., 2014). Thus, it could also simulate the variation in individual plant growth based on the variation in microclimate environments. Several FSPMs for maize growth have been developed. ADEL-maize is an integrated 3-D maize model that simulates the development and growth processes of maize vegetative organs, with the application of morphogenesis adjusted by light availability (Fournier and Andrieu, 1999). A model of GRowth, Architecture and carbon ALlocation (GRAAL) is developed to understand the interaction between architecture and the carbohydrate and nitrogen partitioning processes among individual organs of shoot and individual segments of root for the vegetative phase of individual maize plants (Drouet and Pages, 2003, 2007). Exclusion of the simulation of the reproductive parts limits the application of such models in yield prediction in agronomy. GREENLAB-Maize aims to simulate both biomass production and partitioning between individual organs using a source–sink approach. Although the model can simulate the plant yield well, it is a source-limited model. The crop yield is simulated at the whole-ear level, which is regarded as one organ (Guo et al., 2006; Ma et al., 2008).
The sink capacity of individual kernels has a great impact on the final yield of the maize plant (Borras et al., 2003; Borras and Westgate, 2006). However, most of the current maize models lack the mechanism to simulate the biomass allocation among individual kernels, and thus are incapable of producing the variations of KW in different source–sink environments and in different floret positions of the ear. Therefore, the goal of this research was to revise the current version of the GREENLAB-Maize model to integrate several sub-modules that contain the mechanism of biomass allocation to individual kernels, named GREENLAB-Maize-Kernel. The specific objectives were (1) to estimate the potential individual kernel sink capacity, which will be used for characterizing the individual potential sink demand for all kernels; (2) to incorporate the kernel sink capacity into a source-limited approach to simulate the kernel growth in both source and sink limitation; and (3) to incorporate the remobilization and storage mechanism of non-structural carbohydrates into the model.
MATERIALS AND METHODS
Field experiments and measurements
Field experiments were conducted at the Shangzhuang experimental farm (40°08ʹN, 116°10ʹE) of China Agricultural University. The soil was a sandy clay loam (Aquic Cambisol). Two maize hybrids, ND108 and ZD958 (Zea mays L.), were sown in north–south-oriented rows with two different plant densities in two years. Plant and row spacing was 0.6 m for the low density group, while plant and row spacing were 0.3 and 0.6 m, respectively, for the regular density group. In 2008, ND108 was planted at low and regular density. In 2009, ZD958 was planted at low and regular density while ND108 was planted at only regular density. To reduce the kernel number of the ear, restricted pollination treatments were conducted in each hybrid × plant density treatment combination of each year so that the remaining kernels would grow without source limitation (Table 1). Further details of this experiment can be found in Chen et al. (2013). Meteorological data such as temperature, precipitation and winds were obtained from a standard weather station located within the experimental station.
Table 1.
Field experiments and plant measurements
| Year | Hybrid | Plant density (plant m–2) | Pollination treatment | Times of sampling reproductive organs* | Times of sampling each kernel dry weight in one row of ear† | Times of sampling vegetative organs and leaf area‡ |
|---|---|---|---|---|---|---|
| 2008 | ND108 | 2.8 | Natural | 8 | 8 | 6 |
| Restricted | 8 | –§ | – | |||
| 2008 | ND108 | 5.6 | Natural | 7 | 7 | 7 |
| Restricted | 7 | – | – | |||
| 2009 | ND108 | 5.6 | Natural | 8 | 8 | 4 |
| Restricted | 8 | – | 4 | |||
| 2009 | ZD958 | 2.8 | Natural | 9 | 9 | 4 |
| Restricted | 9 | – | 4 | |||
| 2009 | ZD958 | 5.6 | Natural | 9 | 9 | 4 |
| Restricted | 9 | – | 4 |
*Four replications were selected for each year × hybrid × density × pollination treatment. The dry weight of ten kernels from the 10th to the 15th floret positions, whole ear kernels, husk, shank and cob were measured.
†Two replications were selected for each natural pollination treatment. The dry weight of each kernel in one row of each ear was measured.
‡Four replications were selected for each year × hybrid × density × pollination treatment. The area and dry weight of the leaf and the dry weight of the stem were measured
§‘–’ represents no sampling for the corresponding treatment.
Fifty plants that represented the mean growth were tagged in each treatment combination (pollination × hybrid × plant density) 10 d before silking. There were 200 plants tagged in 2008 and 300 plants tagged in 2009. The silking date of the apical ear was recorded for each selected plant, and the sub-apical ear was bagged prior to its silking to prevent pollination in all treatments. The restricted pollination treatment was conducted by bagging the apical ear 1 d after silking. The apical ears of the naturally pollinated plants were not bagged.
Starting 7 d after silking until harvest, four apical ears were sampled every 7–10 d for each treatment. In total, 16 and 24 ears were sampled each time in 2008 and 2009, respectively. The ears were enclosed in plastic bags and transported immediately to the laboratory in an insulated cooler. Ten kernels from the 10th to 15th floret positions and the husk, shank and cob in each ear were sampled. The dry weights of each kernel were measured after samples were dried to constant weights. Two of the four ears were selected and one row of kernels from each ear were sampled. The individual KW from the two ears was measured for the sampled row of kernels (Table 1). From 5 weeks after emergence to harvest, four plants of each treatment were sampled weekly from the regular density group of ND108 in 2008, and every 3 weeks for the other treatments (Table 1). The green blade area per plant was measured using a LI-COR Model 3100 area metre (Lincoln, NE, USA). The leaf (blade + sheath) and stem of each plant were weighed after drying at 105 °C for 30 min and 80 °C for at least 48 h.
Seven hybrids (LM33, XY998, JD50, JK968, LY66, TN9 and XY335), each with different final KWs, were also planted at a regular density in 2009. Ten kernels from each lower, middle and upper floret position were sampled and their dry weights were measured individually at the late grain-filling stage. These data will be further used partly for model evaluation with various genotypes.
Model description
GREENLAB-Maize is developed to simulate any individual organ production and expansion based on a source–sink approach (Yang et al., 2004). This model is a source-limited model, indicating that the calculated plant yield strongly depends on the biomass supply of the plant and does not consider the sink limit of individual kernels. The effects of climate and planting density on model parameter values were studied in Guo et al. (2006) and Ma et al. (2007, 2008). Based on these studies, we revised the current version and included source- and sink-limited mechanisms in the model (hereafter the revision is referred to as GREENLAB-Maize-Kernel). The specific changes include: (1) light absorption and gross assimilation; (2) maintenance and growth respiration; (3) potential growth demand of the organs; (4) remobilization, storage and assimilate allocation; and (5) determination of kernel number and silking time of individual kernels. The detailed description of each module is documented in the following sub-sections, and parameter values and definitions are listed in Table 2.
Table 2.
Model parameters: symbols, definitions, units and values
| Symbol | Definition | Unit | Value |
|---|---|---|---|
| P m | Saturated assimilation rate | μmol CO2 m–2 of leaf s–1 | 50 |
| α | Photosynthetic efficiency | μmol CO2 μmol–1 PAR | 0.06 |
| θ | Convexity factor | Dimensionless | 0.9 |
| μ | The unit respiratory cost of cellular components turnover | g glucose (g glucose)–1 | 0.0026 |
| η | The unit respiratory cost of maintenance of membranes and ion gradients | g glucose (g d. wt)–1 | 0.000158 |
| S m | Potential maximum number of one row kernels of an ear | Dimensionless | 50 |
| S d | Duration of silking of one row florets of an ear | °Cd | 95 |
| C k | Row number of an ear | Dimensionless | 16 |
| W m | Maximum dry weight of an individual kernel | g | 0.43 |
| K b | Controlling the slope of the logistic function | Dimensionless | –3.5 (kernel) |
| t m | Time when the maximum growth rate is reached | °Cd | 559.6 (kernel) |
| β | The proportion of potentially mobilizable non-structural carbohydrates in reserve organs | Dimensionless | 0.5 |
| φ | The actual fraction of remobilization from potentially mobilizable non- structural carbohydrates | Dimensionless | 0.03 |
| c | Parameter of parabolic function for reserve storage | Dimensionless | –0.000017 (stem) 0.0 (leaf) 0.000002 (other ear organs) |
| d | Parameter of parabolic function for reserve storage | Dimensionless | 0.4 (stem) 0.0 (leaf) 0.17 (other ear organs) |
Light absorption and gross assimilation.
The new modules calculate the unit leaf area light absorption, instantaneous leaf CO2 assimilation, daily canopy gross assimilation and canopy respiration, and replace the photosynthetically active radiation (PAR) use efficiency approach in GREENLAB-Maize with the equations below.
The PAR absorbed by the unit of leaf area (IPAR, μmol m–2 of leaf s–1) is calculated in the model as:
| (1) |
where PAR (μmol m–2 s–1) is hourly instantaneous photosynthetic active radiation which was derived from daily solar radiation (R, MJ m–2 d–1) in Lizaso et al. (2005a). k(δ) is the extinction coefficient that is calculated from solar elevation (δ) (Campbell, 1990) and LAI is leaf area index.
The instantaneous gross assimilation rate (P, μmol CO2 m–2 of leaf s–1) is calculated using a non-rectangular hyperbola function (Thornley and Johnson, 1990):
| (2) |
where Pm is the saturated assimilation rate (μmol CO2 m–2 of leaf s–1), α is photosynthetic efficiency (μmol CO2 μmol–1 PAR) and θ is the convexity factor (dimensionless).
The gross assimilation per plant per day (Qp, g glucose per plant d–1) is:
| (3) |
where G is the green leaf area per plant (m2 per plant), and 1 mol CO2 was assumed to produce 30 g of glucose. The coefficient of unit conversion from μmol s–1 to mol h–1 is 0.0036.
Maintenance and growth respiration.
Maintenance respiration (Rm, g glucose per plant d–1) is calculated based on the approach described in Amthor (2000) and Lizaso et al. (2005a):
| (4) |
where μ and η are estimated by daily air temperature (McCree, 1974) and Qp is the gross assimilation. B is the effective biomass which is calculated as Wilkerson et al. (1983):
| (5) |
where Wl, Ws, Wk and We are the dry weights (g) of leaf (blade + sheath), stem, all kernels per plant and other ear organs (husk + shank + cob), respectively.
The growth respiratory demand for each organ type [Rg(o), g glucose (g organ dry weight growth)–1] is calculated according to its composition (Penning de Vries and van Laar, 1982; Penning de Vries et al., 1989; Lizaso et al., 2005a):
| (6) |
where fc(o), fp(o), fl(o), fg(o), fo(o) and fm(o) are the fraction composition of carbohydrates, proteins, lipids, lignin, organic acids and minerals (ash) in each organ type (‘o’ represents leaf, stem, kernel and other ear organs), respectively. The sum of fc(o), fp(o), fl(o), fg(o), fo(o) and fm(o) is 1. The composition of maize organs was based on table 2 in Lizaso et al. (2005b).
Potential growth demand of the organs.
The potential growth rate of an individual kernel is calculated from the first derivative of a three-parameter logistic function (Systat Software Inc., 2008):
| (7) |
where Wm is the potential dry weight of kernel (g), TT(i) is the thermal time from silking of kernel i (℃d), TTm is the thermal time at which the maximum accumulation rate of the kernel is reached (℃d) and Kb is the slope parameter controlling the rate of dry mass accumulation. The same parameter values of the potential growth rate were used for all individual kernels.
We assumed that there is no sink demand of the vegetative organs (internode, blade and sheath) after silking. Therefore, only ear compartments (individual kernels and other ear organs) competed for biomass in our model. The potential growth demand of all kernels per plant per day (Dk, g glucose d–1) is the product of growth demand per kernel per day multiplied by kernel number:
| (8) |
where DTT is the daily thermal time (T – Tb ℃d), Ck is the row number of the ear, and k refers to kernel. Rg(k) is the growth respiration of kernels and Sm is the potential number of silks (kernel) per row.
The other ear organs are regarded as one organ in the model. The potential growth rate (Ye, g °Cd–1) is also described by the first derivative of the three-parameter logistic function [Eqn (7)]. The potential growth demand per day (De, g glucose d–1) is calculated as:
| (9) |
where Rg(e) is the growth respiration of other ear organs and e refers to other ear organs. The total potential growth demand (D) of the plant is the sum of De and the potential growth demand of all kernels (Dk).
Remobilization, storage and assimilate allocation
The stem, leaf and other ear organs are treated as reserve organs and the assimilate reserves can be remobilized for kernel growth. A comparison of Qp and D was conducted at each time step. When Qp > D, the extra assimilates will be stored in reserve organs whereas when Qp < D, the non-structural carbohydrates will be remobilized from reserve organs.
The assimilate storage is computed by a parabolic function using Eqn (10a) (Keller et al., 1995; Shipley and Meziane, 2002), and the remobilization is modelled with Eqn (10b) (Pallas et al., 2010):
| (10a) | (10b) |
where c and d are the parameters of the parabolic function, Qr is the dry weight of stem or other ear organs (g), β is the proportion of the reserve organ that can potentially be mobilized, and φ is the fraction of actual remobilization from potentially available non-structural carbohydrates. The actual growth of a given organ (∆Qo, g d–1) depends on its potential growth rate, assimilate availability and total demand of the organs, and is calculated as:
| (11a) | (11b) |
where ‘o’ represents individual kernels or other ear organs.
Determination of kernel number and kernel filling time.
The kernel number per plant is calculated using a curvilinear function of the average daily plant growth rare (PGR) with Eqn (12) (Lizaso et al., 2011).
| (12) |
where Sn is the cultivar-specific potential number of seeds on the uppermost ear.
Time from planting to silking is related to PGR (g per plant d–1) and is characterized by the equation: 70.60 + 3.77 × PGR^(–0.699) (Borras et al., 2007). All ears had exserted silks by the time they accumulated 1.0 g of biomass (Borras et al., 2007). The model assumes that kernels start to grow at the lower third region of the ear, then grow to the bottom and middle regions, and end at the top region of the ear (Cárcova and Otegui, 2001; Li et al., 2002). Therefore, the time for each individual kernel filling can be estimated with Eqn (13):
| (13) |
| (14) |
where S is the number of kernels accumulated in one row, Sm is the potential kernel number of one row, TT is the thermal time calculated from silking (°Cd) and TT0 is the thermal time when the first kernel emerges (°Cd). The value of a was estimated based on the thermal time required to reach complete silking of an ear (Sd, °Cd).
Model evaluation and statistics
The simulations were run based on thermal time starting at silking, which was computed using the accumulated mean air temperature above a base temperature of 8 °C (Ritchie and NeSmith, 1991). The model inputs were daily solar radiation, maximum and minimum air temperature, and plant population density. The model parameter values were obtained in three ways: (1) calculating the experimental data with restricted pollination treatment in 2009; (2) searching the literature; and (3) calibrating by fitting the parameter values with measured and simulated data until the minimum deviation occurred.
Significant differences between observational and model means were tested with an analysis of variance (ANOVA) in SAS 9.2 software. A comparison of the slope and intercept of the different linear relationships was done by an analysis of covariance (ANCOVA). The metrics used to evaluate the model include the root mean square error (RMSE) and the percentage relative error (RE):
where Si and Oi are the simulated and measured values. The number of data pairs is denoted as n.
RESULTS
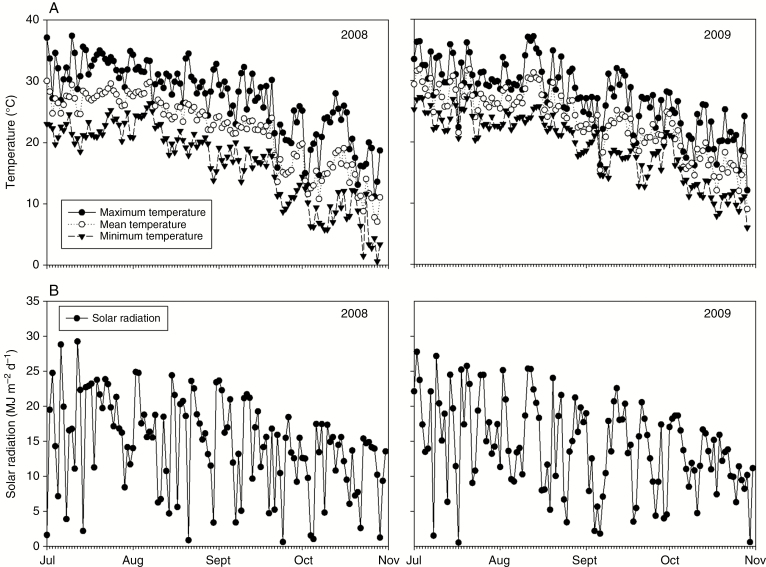
Reproductive growth and development occurred from July to October in 2008 and 2009. In the studied area, daily mean air temperature reached a peak in early August and began to decrease afterward (Fig. 1), and varied slightly from 2008 to 2009. In 2008, it was relatively cooler than 2009, resulting in silking dates that were 2 weeks later. Large fluctuations in daily solar radiation occurred during the reproductive growth stages in both years (Fig. 1). However, no difference was found in accumulated solar radiation from silking to harvest in both years.
Fig. 1.
Daily mean air temperature (A) and solar radiation (B) from 1 July to 1 November in 2008 and 2009.
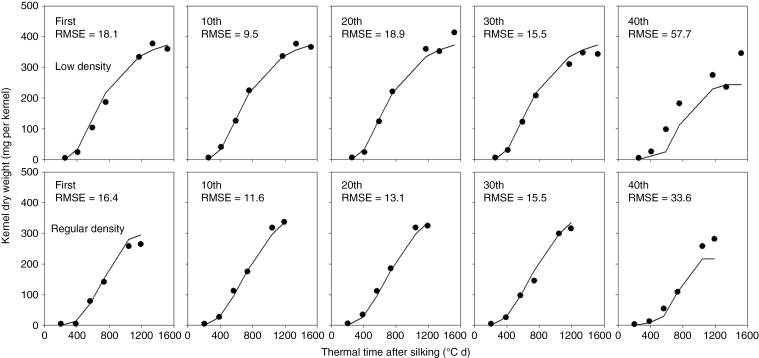
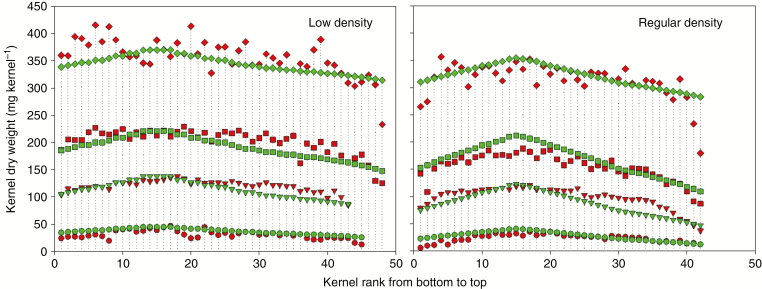
The accuracy of individual kernel growth for different floret positions [from first (bottom) to 40th (top)] were analysed in Fig. 2. Generally, model-calculated KWs at different positions were consistent with the measured values, except for the apical (40th position) kernels. Kernel weights were underestimated at the later stage (40th) of grain filling for apical kernels, and the RMSE for the 40th kernel was significantly larger than for other positions. The individual KW of the apical section was the smallest and significantly different from that of the lower third sections for all treatments (P < 0.05). There was good agreement between the simulated and measured individual KWs in one row of the ear in both low and regular density treatments (Fig. 3). During the early grain-filling stage, the individual KWs along the rachis of the ear for different plant densities were quite close, except for the apical kernels which were significantly smaller than other kernels. During the later grain-filling stage, the individual KWs around the lower third section were the largest, while the KWs for the basal and apical positions were substantially lower, especially for the apical kernels in the regular density group. The trends were similar between measured and simulated kernels. However, large differences were found between simulated and measured individual kernels in the basal and apical positions.
Fig. 2.
Simulation of kernel dry matter accumulation on the first,10th, 20th, 30th and 40th positions in one row of the ear in low and regular density in 2008, compared with actual measurements.
Fig. 3.
Simulation of the dry weight of each kernel in one row of an ND108 ear at different growth stages in low and regular density in 2008, compared with actual measurements. The four stages indicate 15, 22, 29 and 71 d after silking in low density, and 14, 21, 28 and 49 d after silking in regular density.
Comparisons between simulated and measured kernel basic traits demonstrate that model-calculated basic traits are very close to observations (within 5 % of the observed values, Table 3). Table 3 also shows that simulations of the kernel growth rate were higher than measurements at the regular density, except for the hybrid ND108 in regular density from 2008. The model-calculated durations of linear kernel filling were higher than the measured data, except for the hybrid ND108 from 2009. Calculated kernel numbers were higher for low density and lower for regular density than the measured data, except for the hybrid ND108 in 2009. The kernel growth rate was larger for hybrid ND108 than hybrid ZD958, and in low density than regular density. The final individual KW was always higher at low density than at regular density. The duration of kernel filling was higher in low density than in regular density and in hybrid ZD958 than in ND108. A similar trend was also found for kernel number.
Table 3.
Comparison between simulated and measured kernel number per plant, final individual kernel weight, kernel growth rate of linear grain filling and duration of linear grain filling for the different treatments
| Year | Hybrid | Plant density | Kernel number per plant | Final individual kernel weight | Kernel growth rate of linear grain-filling | Duration of linear grain-filling | ||||||||
|---|---|---|---|---|---|---|---|---|---|---|---|---|---|---|
| Sim ± s.d. | Mea ± s.d. | RE (%) | Sim ± s.d.(mg °C–1 d–1) | Mea ± s.d. (mg °C–1 d–1) | RE (%) | Sim ± s.d. (mg °C–1 d–1) | Mea ± s.d. (mg °C–1 d–1) | RE (%) | Sim ± s.d. (°Cd) | Mea ± s.d. (°Cd) | RE (%) | |||
| 2008 | ND108 | 2.8 | 688 ± 21 | 677 ± 26 | 2.6 | 0.355 ± 0.012 | 0.376 ± 0.016 | 5.8 | 0.51 ± 0.02 | 0.49 ± 0.03 | 5.1 | 691 ± 38 | 673 ± 25 | 3.5 |
| 2008 | ND108 | 5.6 | 592 ± 35 | 606 ± 31 | 3.5 | 0.295 ± 0.013 | 0.298 ± 0.033 | 4.7 | 0.46 ± 0.02 | 0.47 ± 0.05 | 7.4 | 689 ± 79 | 657 ± 28 | 2.6 |
| 2009 | ND108 | 5.6 | 586 ± 19 | 580 ± 23 | 6.9 | 0.318 ± 0.021 | 0.307 ± 0.004 | 2.1 | 0.43 ± 0.01 | 0.42 ± 0.02 | 5.8 | 647 ± 54 | 665 ± 60 | 4.1 |
| 2009 | ZD958 | 2.8 | 736 ± 22 | 706 ± 29 | 2.3 | 0.374 ± 0.015 | 0.369 ± 0.048 | 3.6 | 0.46 ± 0.02 | 0.48 ± 0.03 | 4.3 | 774 ± 68 | 758 ± 17 | 5.2 |
| 2009 | ZD958 | 5.6 | 603 ± 28 | 617 ± 33 | 2.1 | 0.307 ± 0.019 | 0.339 ± 0.026 | 4.5 | 0.42 ± 0.01 | 0.40 ± 0.03 | 2.1 | 762 ± 44 | 727 ± 13 | 2.7 |
Mea, measured; Sim, simulated; RE, relative error.
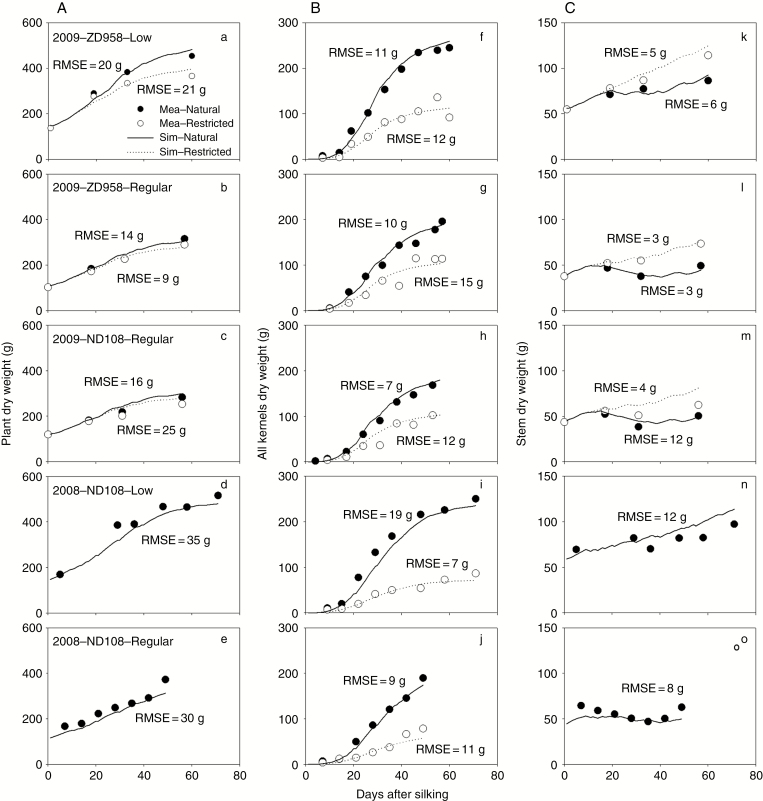
The results also clearly show that the model was able to produce the growth differences among different source–sink ratio treatments for each organ type (Fig. 4). The stem dry weight of the plants in low density with restricted pollination treatments kept increasing, while the stem dry weight of the plants in regular density with the natural pollination treatment increased before decreasing during the effective kernel-filling stage. The simulations were able to reproduce these trends in observations (Fig. 4). The RMSE between simulated and measured dry weight varies from 9 to 35 g for individual plants, from 7 to 19 g for kernels and from 3 to 12 g for stems.
Fig. 4.
Comparison between simulated (Sim) and measured (Mea) dry weight of individual plants (A: a–e), all kernels of the ear (B: f–j) and stem (C: k–o) from silking for different hybrids (ND108 and ZD958), plant densities (low and regular) and pollination treatments (natural and restricted) in 2008 and 2009.
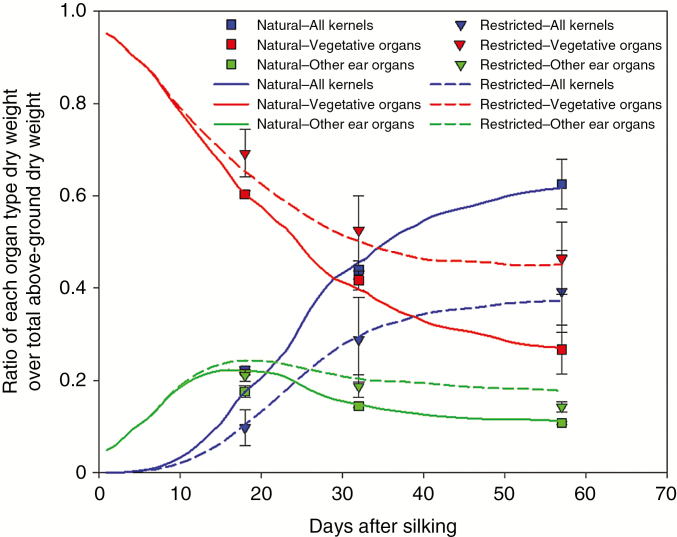
The temporal variations of the dry weight ratio for both natural and restricted treatments of hybrid ZD958 in 2009 (Fig. 5) in the model simulations were presented after calibrating the predicted kernel number (Table 3) and individual kernel growth (Table 3; Figs 2 and 3). The trends in the model simulations match observations well (Fig. 5). The proportion of dry weight allocated to kernels increased and reached a maximum at the final stage. The proportion of photosynthetic assimilates stored in the vegetative organs and other ear organs decreased in the natural pollination treatment due to the sink strength of kernels. The simulated results for the other hybrid, year and treatment also agreed well with the measurement, and the general trends were quite close with those in Fig. 5 (data not shown here).
Fig. 5.
Ratio of the dry weights of the kernel, vegetative organ and other ear organs over total above-ground dry weight as a function of days after silking for the regular density of hybrid ZD958 in 2009.
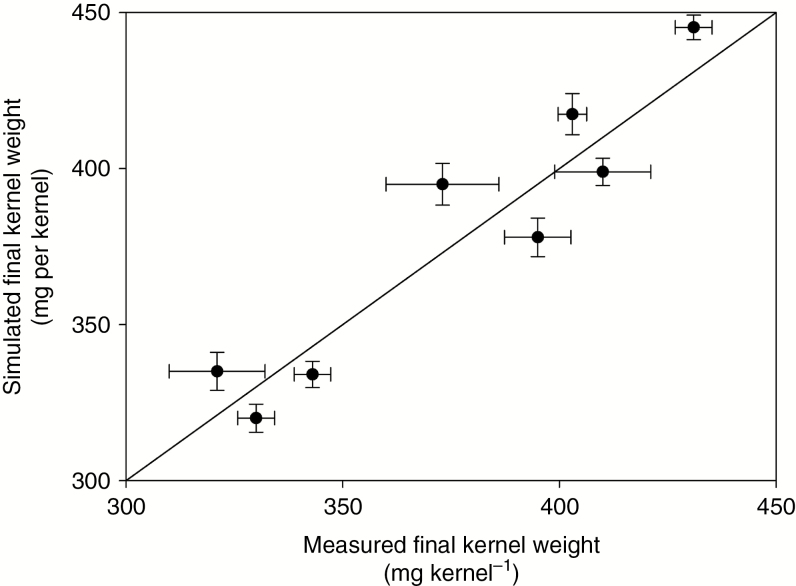
Figure 6 shows how the measured final KW was successfully predicted using this approach for a wide range of genotypes. The measured final KWs range between 320 and 430 mg per kernel. Larger variations were found for the measured final KWs than for the simulated data.
Fig. 6.
Simulated final kernel weight and measured final kernel weight for different genotypes. The final kernel weights ranged between 320 and 430 mg per kernel.
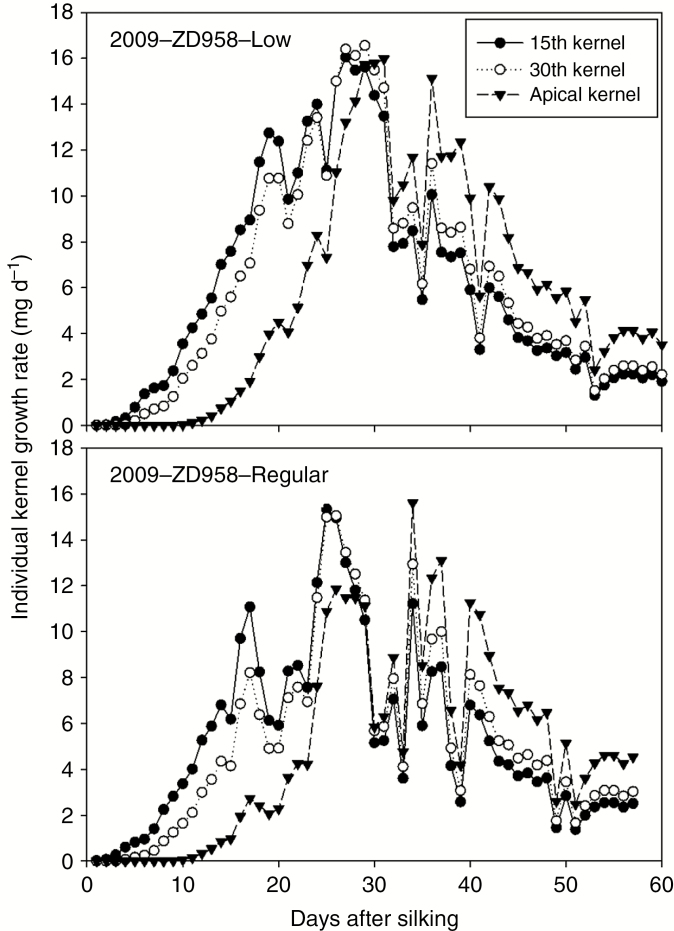
The difference in growth among kernels at different floret positions is plotted in Fig. 7. The growth rate is computed using the current biomass and the kernel demand for biomass, as described in Eqn (11). It can be seen in Fig. 7 that there was a clear delay in kernel filling for apical kernels. Although the same potential sink strength was used in all treatment combinations, the simulated individual kernel growth rates were substantially different among floret positions, density treatments and final individual KWs.
Fig. 7.
Simulated individual kernel growth rates for the 15th, 30th and apical kernels of the ear for low and regular densities of ZD958 with natural pollination in 2009.
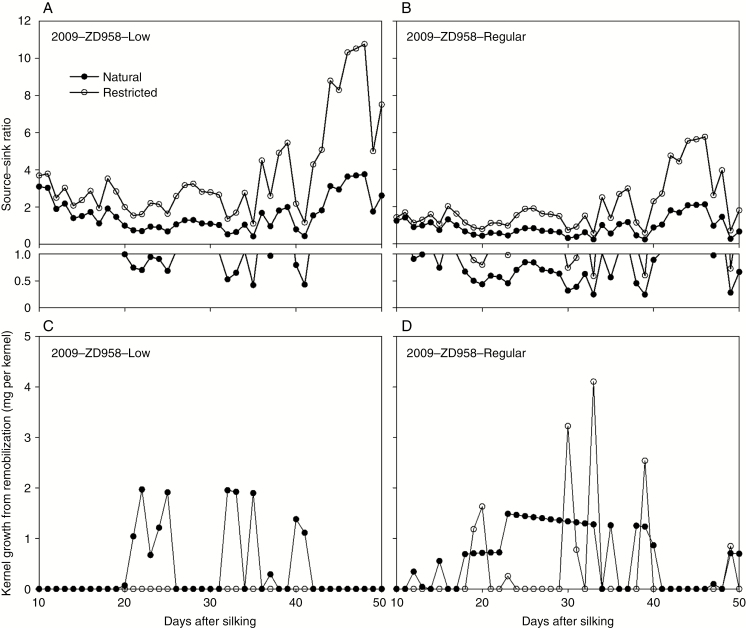
The variation of the source–sink ratio during the effective kernel-filling period (10–50 d after silking) was calculated and is displayed in Fig. 8A and B. As shown in Fig. 8A and B, the source–sink ratio varied and showed wave-like patterns. As the sink of the kernels decreased at the late stage, the source–sink ratio increased substantially in the low density with restricted pollination group. Photosynthesis production decreased and the source–sink ratio decreased accordingly. In this study, the source is limited when the source–sink ratio is <1. The source limit occurred most frequently in regular density with natural pollination and less frequently in low density with restricted pollination. The average source–sink ratio over the effective kernel-filling stage (10–50 d after silking) for each treatment (year × pollination × density × hybrid) varied from 0.92 to 4.63. The source–sink ratio is inversely related to the kernel number per plant and density in treatments.
Fig. 8.
Simulated source–sink ratio (A, B) and remobilization (C, D) for kernel growth for the low and regular plant density groups of ZD958 with natural and restricted pollination in 2009. Source is computed as the simulated plant photosynthetic assimilation minus maintenance respiration and sink is the total growth demand of the plant. The data points with source sink–ratios between 0 and 1 were redrawn and put below the original figures of (A) and (B).
Remobilization from the reserve organs to kernels occurs when the source–sink ratio is <1, and this remobilization occurs more frequently in the regular density treatment (Fig. 8C, D). The total amount of assimilates remobilized to kernels was highest in the regular density with natural pollination group (26.4 mg per kernel), while no remobilization occurred in the low density with restricted pollination group. The proportion of KWs coming from remobilization ranged from 0 (2009, ZD958, low density, restricted pollination) to 8.8 % (2009, ZD958, regular density, natural pollination) for all the treatment combinations in our current simulation study. The percentage of the days for remobilization was >70 % for both hybrids in the regular density treatment.
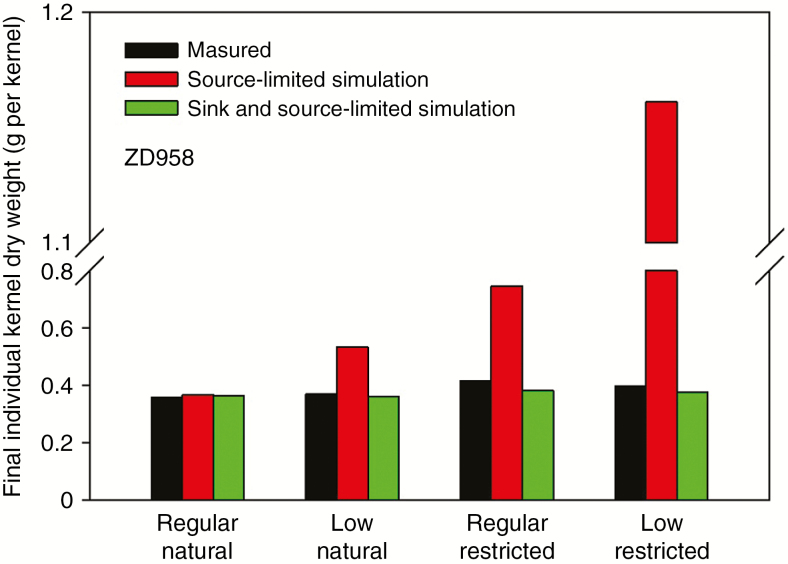
The results indicated that simulated individual KWs matched observations well in natural pollination groups planted with regular density when the model only included the source-limited growth. Large differences occurred between the model simulation and observations for the other treatments. When including source- and sink-limited mechanisms, models were able to reproduce observations and the RE was within 10 % for all our source–sink treatments.
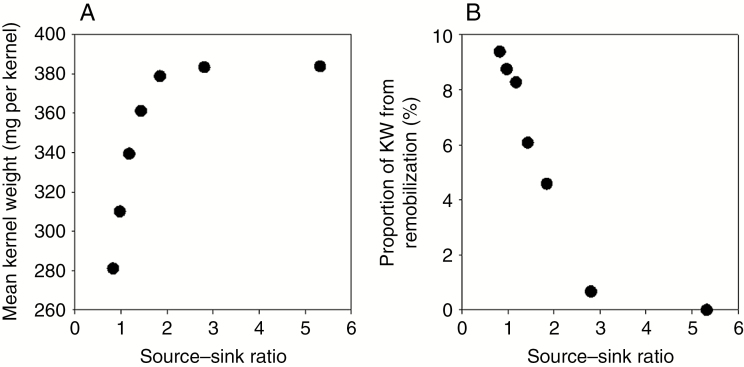
We also investigated the impact of kernel numbers on individual KW in the model simulations by increasing the kernel number per ear from 100 to 700 with an increment of 100. In the model simulation, the increase in the source–sink ratio is associated with a decrease in kernel number. As shown in Fig. 9A, the mean individual KW increases as the source–sink ratio increases from 1 to 2 and remains relatively stable once the source–sink ratio reaches ≥2. The contribution of remobilization to KW decreased dramatically from approx. 10 % to 0 when the source–sink ratio decreases from 1 to 3 (Fig. 9B).
Fig. 9.
Mean simulated kernel weight (A) and proportion of kernel weight from remobilization (B) as a function of the source–sink ratio.
DISCUSSION
The kernel number per unit land area and the individual kernel dry weight are two important contributors to maize yield (Blum, 1998; Borras and Gambin, 2010). Therefore, an improved understanding of yield responses to alterations in assimilate availability and sink demand during plant growth is important for designing strategies aimed at maximizing yield through plant breeding and crop management. In this study, we revised the GREENLAB-Maize model to include the individual kernel-filling process based on the source–sink concept and evaluated the new model, GREENLAB-Maize-Kernel, with experimental data collected in field experiments that included year × hybrid × density × pollination treatments. The dynamics of the source- and sink-limited processes and the remobilization of non-structural carbohydrates during plant growth were also quantified.
We developed and tested our model for individual kernels with detailed information on individual kernel growth rate (Table 3), duration of kernel filling (Table 3; Fig. 2) and KW (Table 3; Figs 2 and 3) for two genotypes. The model was able accurately to produce the dynamic response of the individual kernels (Figs 2 and 3) and the growth of the other organs (Fig. 4) for the range of treatments in the experiments that represented a variation in source–sink ratios. Combined with the kernel number per plant simulation [Eqn (12)], the final KW of an individual plant was simulated well (Figs 2 and 3; Table 3). Two genotypes in our study showed a similar trend where high plant growth rates are observed in low density stand conditions and plants show more kernels and a higher KW than under a high stand density (Borras et al, 2003, 2010). Limited KW and kernel growth variability were observed for the two genotypes. We also predicted the final individual KW for seven commercial hybrids with individual KWs ranging from 320 to 430 per kernel (Fig. 6). However, KW and its development show a wide variability due to interactions of the genotype, the environment and the crop management (Gambin et al., 2006; Borras and Gambin, 2010). A more extensive testing of the model on maize kernel size, kernel growth rate and duration of kernel filling for a wider range of genotypes and growing environments is needed in the future.
Growing conditions during the kernel set period affect the assimilates available per kernel and the potential KW. During this period, plants are adjusting their kernel numbers to the rate of plant growth (Jones et al., 1996; Borras and Westgate, 2006). Research indicates that the proportion of the biomass allocated to the ear varies dramatically with the plant growth rate, with a non-linear response and a minimum threshold for ear growth (Borras et al., 2007; Borras and Grambin, 2010). Evidence has shown that the maize canopies determine their potential kernel size and number mostly at the same time (Gambin et al., 2006; Borras and Gambini, 2010), so kernel number determination is critical for any seed development modelling effort. In our model, the kernel number per plant is determined by the average daily plant growth rate adopted from Lizaso et al. (2011). This will need to be expanded in the future, mostly because of its importance in the kernel number vs. kernel size determination trade-off, especially for more genotype and environmental conditions.
In maize, progress towards silking is highly dependent upon the environmental conditions around flowering. The time to silking depends on the biomass accumulation at the ear level. The fewer resources captured by the crop, the greater the delay in silking. In our model, the time from planting to silking was related to the plant growth rate and assumed that all ears had exserted silks by the time they accumulated 1.0 g. Severe limitations in plant growth during the effective grain-filling period (due to drought, nutrient stress, etc.) shorten the effective grain-filling period by accelerating kernel desiccation (Jones and Simmons, 1983; Westgate, 1994); coefficients affecting duration of grain filling and silking dynamics still need to be determined. Furthermore, plants within a maize canopy differ in their growth rate around flowering – plants with rapid growth rates reach silking earlier than those growing at lower rates. Quantifying canopy plant to plant variability in pollen shed, silking, and kernel size and number is a critical component for simulating the formation of reproductive sinks (Lizaso et al., 2003, 2007).
Generally, plants that grow under higher planting density conditions have source-limited growth, especially during the effective grain-filling period. This indicates that the photosynthetic supply is insufficient to meet the demand for kernel growth (Fig. 8). Therefore, modelling the remobilization of the non-structural carbohydrates process is an important aspect for determining the final KW, especially when the assimilate availability is reduced (Andrade and Ferreiro, 1996). The remobilization process functions responding to the source–sink dynamics during the kernel-filling process provided a buffer between the photosynthetic production and the growth demand of the organs (Savin and Slafer, 1991; Kiniry et al., 1992; Borras et al., 2004). Furthermore, Uhart and Andrade (1995) reported a linear relationship between the contribution of stem carbohydrates to KW and the source–sink ratio from field experimental data. We introduced a linear relationship between remobilization and source–sink ratio when the source–sink ratio was <3 (Fig. 10B), which means that if the net assimilate is larger than three times the total kernel demand, there is almost no remobilization contributing to kernel growth. Our simulation study showed that the contribution of remobilized assimilates to kernels varied widely among different source–sink conditions (from 0 to 8.8 %), within the range of the experimental results (from –13 to 17 %) in Uhart and Andrade (1995).
Fig. 10.
The comparison of average kernel dry weights at the 10th–15th positions of the ear between measurement, source-limited simulation and sink- and source-limited simulation in each treatment combination (density × pollination treatment) of ZD958.
Some models such as GREENLAB-Maize (Guo et al., 2006; Kang et al., 2012) simulate yield as a source-limited process. Failure to account for sink-limited kernel growth may lead to significant errors in simulation results, as shown in Fig. 10. Integrating the mechanisms of simulating sink-limited kernel growth with source-limited kernel growth, as in our model, will account for a wider range of variability in the biological processes controlling kernel growth. This study highlights the potential of the current model for producing a variation in KW for different genotypes and environmental conditions, and for the selection of kernel yield for improved plant performance in specific environments.
ACKNOWLEDGEMENTS
This work was supported by the National Key Research and Development Program of China (2016YFD0300202) and the National Natural Science Foundation of China (Nos 31210103906 and 31000671). It was also part of the PhD project of Y. J. Chen, which was funded by the China Scholarship Council with the support of the AgWeatherNet Program at Washington State University, Prosser, Washington, USA.
LITERATURE CITED
- Amthor JS. 2000. The McCree–deWit–Penning de Vries–Thornley Respiration Paradigms: 30 years later. Annals of Botany 86: 1–20. [Google Scholar]
- Andrade FH, Ferreiro MA. 1996. Reproductive growth of maize, sunflower and soybean at different source levels during grain filling. Field Crops Research 48: 155–165. [Google Scholar]
- Barnett KH, Peace RB. 1983. Source–sink ratio alteration and its effect on physiological parameters in maize. Crop Science 23: 294–299. [Google Scholar]
- Boote KJ, Jones JW, White JW, Asseng S, Liazso JI. 2013. Putting mechanisms into crop production models. Plant, Cell and Environment 36: 1658–1672. [DOI] [PubMed] [Google Scholar]
- Blum A. 1998. Improving wheat grain filling under stress by stem reserve mobilization. Euphytica 100: 77–83. [Google Scholar]
- Borrás L, Gambín BL. 2010. Trait dissection of maize kernel weight: towards integrating hierarchical scales using a plant growth approach. Field Crops Research 118: 1–12. [Google Scholar]
- Borrás L, Westgate ME. 2006. Predicting maize kernel sink capacity early in development. Field Crops Research 95: 223–233. [Google Scholar]
- Borrás L, Westgate ME, Otegui ME. 2003. Control of kernel weight and kernel water relations by post-flowering source–sink ratio in maize. Annals of Botany 91: 857–867. [DOI] [PMC free article] [PubMed] [Google Scholar]
- Borrás L, Slafer GA, Otegui ME. 2004. Seed dry weight response to source–sink manipulations in wheat, maize and soybean: a quantitative reappraisal. Field Crops Research 86: 131–146. [Google Scholar]
- Borrás L, Westgate ME, Juan P, Astini JP, Echarte L. 2007. Coupling time to silking with plant growth rate in maize. Field Crops Research 102: 73–85. [Google Scholar]
- Campbell GS. 1990. Derivation of an angle density function for canopies with ellipsoidal leaf angle distributions. Agricultural and Forest Meteorology 49: 173–176. [Google Scholar]
- Cárcova J, Otegui ME. 2001. Ear temperature and pollination timing effects on maize kernel set. Crop Science 41: 1809–1815. [Google Scholar]
- Cárcova J, Otegui ME. 2007. Ovary growth and maize kernel set. Crop Science 47: 1104–1110. [Google Scholar]
- Chen YJ, Hoogenboom G, Ma YT et al. 2013. Maize kernel growth at different floret positions of the ear[J]. Field Crops Research 149: 177–186. [Google Scholar]
- Crawford TW, Rendig VV, Broadbent FE. 1982. Sources, fluxes, and sinks of nitrogen during early reproductive growth of maize (Zea mays L.). Plant Physiology 70: 1654–1660. [DOI] [PMC free article] [PubMed] [Google Scholar]
- Drouet JL, Pages L. 2003. GRAAL: a model of growth, architecture and carbon allocation during the vegetative phase of the whole maize plant-model description and parameterization. Ecological Modeling 165: 147–173. [Google Scholar]
- Drouet JL, Pages L. 2007. GRAAL-CN: a model of growth architecture and allocation for carbon and nitrogen dynamics within whole plants formalized at the organ level. Ecological Modeling 206: 231–249 [Google Scholar]
- Fournier C, Andrieu B. 1999. ADEL-maize: an L-system based model for the integration of growth processes from the organ to the canopy. Application to regulation of morphogenesis by light availability. Agronomie 19: 313–327. [Google Scholar]
- Gambín BL, Borrás L. 2007. Plasticity of sorghum kernel weight to increased assimilate availability. Field Crops Research 100: 272–284. [Google Scholar]
- Guo Y, Ma YT, Zhan ZG et al. 2006. Parameter optimization and field validation of the functional–structural model GREENLAB for maize. Annals of Botany 97: 217–230. [DOI] [PMC free article] [PubMed] [Google Scholar]
- Hanft JM, Jones RJ, Stumme AB. 1986. Dry matter accumulation and carbohydrate concentration patterns of field-grown and in vitro cultured maize kernels from the tip and middle ear positions[J]. Crop Science 26:568–572. [Google Scholar]
- Hoogenboom G, Porter CH, Wilkens PW, Boote KJ, Hunt LA, Jones JW. 2010. The Decision Support System for Agrotechnology Transfer (DSSAT): past, current and future developments. In: Program and Summaries, 40th Biological Systems Simulation Conference, Maricopa, 13–15. [Google Scholar]
- Jones CA, Kiniry JR. 1986. CERES-Maize: a simulation model of maize growth and development. College Station, TX: Texas A&M University Press. [Google Scholar]
- Jones JW, Hoogenboom G, Porter KJ et al. 2003. The DSSAT cropping system model. European Journal of Agronomy 18: 235–265. [Google Scholar]
- Jones RJ, Simmons SR. 1983. Effect of altered source–sink ratio on growth of maize kernels. Crop Science 23: 129–134. [Google Scholar]
- Jones RJ, Schreiber BMN, Roessler JA. 1996. Kernel sink capacity in maize: genotypic and maternal regulation. Crop Science 36: 301–306. [Google Scholar]
- Kang MZ, Heuvelink E, Carvalho SMP, de Reffye P. 2012. A virtual plant that responds to the environment like a real one: the case for chrysanthemum. New Phytologist 195: 384–395. [DOI] [PubMed] [Google Scholar]
- Keating BA, Carberry PS, Hammer GL. 2003. An overview of APSIM, a model designed for farming systems simulation. European Journal of Agronomy 18: 267–288. [Google Scholar]
- Keller MB, Hess B, Schwager H, Scharer H, Koblet W. 1995. Carbon and nitrogen partitioning in Vitis vinifera L.: responses to nitrogen supply and limiting irradiance. Vitis 34: 19–26. [Google Scholar]
- Kiniry JR, Tischler CR, Rosenthal WD, Gerik TJ. 1992. Nonstructural carbohydrate utilization by sorghum and maize shaded during grain growth. Crop Science 32: 131–137. [Google Scholar]
- Li J, Cui Y, Dong H, Wang Y, Zhang L. 2002. Study on the dynamics of growth and development of summer-maize silks. Maize Science 10: 45–49. [Google Scholar]
- Lizaso JI, Westgate ME, Batchelor WD, Fonseca A. 2003. Predicting potential kernel set in maize from simple flowering characteristics. Crop Science 43: 892–903. [Google Scholar]
- Lizaso JI, Batchelor WD, Boote KJ, Westgate ME. 2005a Development of a leaf-level canopy assimilation model for CERES-Maize. Agronomy Journal 97: 722–733. [Google Scholar]
- Lizaso JI, Batchelor WD, Boote KJ, Westgate ME, Rochette P, Moreno-Sotomayor A. 2005b Evaluating a leaf-level canopy assimilation model linked to CERES-Maize. Agronomy Journal 97: 734–740. [Google Scholar]
- Lizaso JI, Fonseca A, Westgate ME. 2007. Simulating source-limited and sink-limited kernel set with CERES-Maize. Crop Science 47: 2078–2088. [Google Scholar]
- Lizaso JI, Boote K, Jones J et al. 2011. CSM-IXIM: a new maize simulation model for DSSAT Version 4.5. Agronomy Journal 103: 766–779. [Google Scholar]
- Ma YT, Li BG, Zhan ZG et al. 2007. Parameter stability of the functional–structural plant model GREENLAB as affected by variation within populations, among seasons and among growth stages. Annals of Botany 99: 61–73. [DOI] [PMC free article] [PubMed] [Google Scholar]
- Ma YT, Wen MP, Guo Y, Li BG, Cournede PH, de Reffye P. 2008. Parameter optimization and field validation of the functional–structural model GREENLAB for maize at different population densities. Annals of Botany 101: 1185–1194. [DOI] [PMC free article] [PubMed] [Google Scholar]
- Martinez-Carrasco R, Cervantes E, Perez P, Morcuende R, Martin Del Molino IM. 1993. Effect of sink size on photosynthesis and carbohydrate content of leaves of three spring wheat varieties. Physiologia Plantarum 89: 453–459. [Google Scholar]
- McCree KJ. 1974. Equations for the rate of dark respiration of white clover and grain sorghum, as function of dry weight, photosynthetic rate, and temperature. Crop Science 14: 509–514. [Google Scholar]
- Pallas B, Loi C, Christophe A, Cournede PH, Lecoeur J. 2010. Comparison of three approaches to model grapevine organogenesis in conditions of fluctuating temperature, solar radiation and soil water content. Annals of Botany 107: 729–745. [DOI] [PMC free article] [PubMed] [Google Scholar]
- Penning de Vries FWT, van Laar HH. 1982. Simulation of growth processes and the model BACROS. In: Penning de Vries FWT, van Laar HH, eds. Simulation of plant growth and crop production. Wageningen, The Netherlands: Centrum voor Landbouwpublikaties en Landbouwdocumentatie, 114–135. [Google Scholar]
- Penning de Vries FWT, Jansen DM, ten Berge HFM, Bakema A. 1989. Simulation of ecophysiological processes of growth in several annual crops. Simulation Monogragh 29. Wageningen, The Netherlands: Pudoc. [Google Scholar]
- Reddy VM, Daynard TB. 1983. Endosperm characteristics associated with rate of grain filling and kernel size in corn. Maydica 28: 339–355. [Google Scholar]
- Ritchie JT, NeSmith DS. 1991. Temperature and crop development. In: Hanks J, Ritchie JT, eds. Modeling plant and soil systems. Madison, WI: American Society of Agronomy, 5–29. [Google Scholar]
- Savin R, Slafer GA. 1991. Shading effects on the yield of an Argentinian wheat cultivar. Journal of Agricultural Science 116: 1–7. [Google Scholar]
- Shipley B, Meziane D. 2002. The balanced-growth hypothesis and the allometry of leaf and root biomass allocation. Functional Ecology 16: 326–331. [Google Scholar]
- Sievanen R, Godin C, DeJong TM, Nikinmaa E. 2014. Functional–structural plant models: a growing paradigm for plant studies. Annals of Botany 114: 599–603. [DOI] [PMC free article] [PubMed] [Google Scholar]
- Systat Software Inc. 2008. SigmaPlot 11.0: analyze and graph your data with unparalleled ease and precision. San Jose, CA. [Google Scholar]
- Smith DL, Hamel C. 1999. Crop yield – physiology and processes. Berlin Heidelberg: Springer-Verlag. [Google Scholar]
- Thornley JHM, Johnson IR. 1990. Plant and crop modeling. A mathematical approach to plant and crop physiology. Oxford: Clarendon Press. [Google Scholar]
- Tollenaar M, Daynard TB. 1982. Effect of source–sink ratio on dry matter accumulation and leaf senescence of maize. Canadian Journal of Plant Science 62: 855–860. [Google Scholar]
- Uhart SA, Andrade FH. 1995. Nitrogen and carbon accumulation and remobilization during grain filling in maize under different source/sink ratios. Crop Science 35: 183–190. [Google Scholar]
- Vos J, Evers JB, Buck-Sorlin GH, Andrieu B, Chelle M, de Visser PHB. 2010. Functional–structural plant modelling: a new versatile tool in crop science. Journal of Experimental Botany 61: 2101–2115. [DOI] [PubMed] [Google Scholar]
- Westgate ME. 1994. Water status and development of maize endosperm and embryo during drought. Crop Science 34: 76–83. [Google Scholar]
- Wilkerson GG, Jones JW, Boote KJ, Ingram KT, Mishoe JW. 1983. Modeling soybean growth for crop management. Transactions of the American Society of Agricultural Engineers 26: 63–73. [Google Scholar]
- Yang HS, Dobermann A, Lindquist JL, Walters DT, Arkebauer TJ, Cassman KG. 2004. Hybrid–maize – a maize simulation model that combines two crop modeling approaches. Field Crops Research 87: 131–154. [Google Scholar]


